FE 'tkGooie' Utility
'MAPtools' group
Tk Script to
Make an Outline-Data File
by Picking Points
on an Image
FE 'tkGooie' Utility'MAPtools' group
Tk Script to
|
FE Home Page >
FE Downloads Page >
FE 'tkGooies' Description Page >
FE 'tkGooies' 'MAPtools' Page >
This
'tkMakeOutlineFile_ byPickPointsOnImage'
Code Page
|
INTRODUCTION to Tcl-Tk script In 2016, I 'published' a 'tkGooie' nicknamed 'tkReadOutlineFile_drawOutlineOnCanvas' to do as the nickname suggests: That 'tkGooie' reads an 'outline-data' file (of a simple text-file format) and draws an outline on a Tk 'canvas' widget. The 'outline-data' file is expected to have a very simple format: Each line of the file contains x,y coordinates (which may be a longitude-latitude pair, in decimal degrees) on each data line of the input file. Note that the outline data in the file does not have to be longitude-latitude map data. It could be pairs of coordinates that provide an outline of almost any object --- for example, a silouette of a person or an animal or an insect or a fish or a plant. OR, the data file could provide an outline of a logo --- or a group of alphanumeric characters in one or more font styles. OR, the data file could provide vertex coordinates of a geometric figure like a pentagon or hexagon or octagon --- regular or irregular. OR, a more complicated geometric figure could be defined by the points in the file --- such as a fractal-like geometric figure, like the 3rd or 4th level of a 'Koch Snowlake'. In fact, the outline data could depict a snowflake --- or flower petals --- or the outline of a leaf --- or the outline of tree branches. Use your imagination.
SOURCES OF OUTLINE DATA : There are many outline (boundary) data files on the internet --- in *ASCII* text (non-binary) format --- for continents, countries, regions, states, counties, provinces, etc. Examples:
There is a lot of XML-like markup language in '.geojson' and '.kml' files (uncompressed '.kmz' files). For input to a 'tkGooie' utility like the 'tkReadOutlineFile_ drawOutlineOnCanvas' tkGooie, the user can take those KML or GeoJSON files and 'clean them up' so that there are only a pair of space-separated (or comma-separated) decimal numbers at the start of each line. There is much more discussion (and references) for KML and GeoJSON files on the There are shell scripts in a 'MAPtools' group of the 'FE Nautilus Scripts' subsystem that I used to extract the x,y coordinate pairs from KML and GeoJSON files and re-format the data to one x,y point per data line --- with very few 'left-overs' (XML tags). Some manual editing with a text editor was used to 'clean up' the remnants. I used those 'MAPtools' FE 'Nautilus Scripts' to provide extracted data from many KML and GeoJSON files --- in the simple 'FE outline data' file format. You can see those map-outline files via a Map Data Sources page.
NOTE: You can think of the LONGITUDE value as providing the X-distance along the equator of a planet, and the LATITUDE value as providing the Y-distance from the equator to a north or south pole. The LONGITUDE angle is usually specified between -180 and +180 degrees --- from a zero longitude (like the longitude line through Greenwich, England on Earth). The LATITUDE angle is usually specified between -90 and +90 degrees, measured from the equator. I also provided some 'NON-MAP' outline-data files via a NON-MAP Data Sources page. I used a 'MAPtools' FE 'Nautilus Script' to extract data from SVG (Scalable Vector Graphics) files. However ... --- A Reason for this 'tkGooie' Sometimes one cannot find the outline data that one wants in a KML or GeoJSON or SVG file (or other ASCII text file). It would be nice to be able to make one's own outline file --- say, by picking points on an image file --- where the image file could be a map or a non-map (say, a picture of an animal or a plant or a machine or whatever). That is the goal of the 'tkGooie' presented on this page. This 'tkGooie' is meant to allow the user to choose an image file, and then allow the user to pick points on the image to make 'loops' of points --- for example, boundaries of countries or regions --- including boundaries of lakes and islands. Finally, the GUI is to allow the user to write an 'outline-data' file from the points (and loops) picked. PLANNED LAYOUT OF THE GUI: As I have done for other Tk scripts that I have written since about 2015, I laid out a 'text sketch' of the GUI --- to aid me as I coded the frames and widgets and bindings and procs. I used the following conventions to make the sketch of the GUI. |
  SQUARE-BRACKETS indicate a comment (not to be placed on the GUI).
  BRACES          indicate a Tk 'button' widget.
  A COLON         indicates that the text before the colon is on a 'label' widget.
  UNDERSCORES     indicate a Tk 'entry' widget.

  CAPITAL-X       indicates a Tk 'checkbutton' widget (if any).
  CAPITAL-O       indicates a Tk 'radiobutton' widget (if any).
  <---O--->       indicates a horizontal Tk 'scale' widget (if any).
|
According to those conventions, I created the following 'text sketch'. |
 FrameNames
 VVVVVVVVVV
             ------------------------------------------------------------------------------------------
             Make an Outline File - by Picking Points on an Image
             [window title]
             ------------------------------------------------------------------------------------------

 .fRbuttons   {Exit} {Help} {EndLoop} {WriteFile} [a label to give feedback to user on point picks goes here]

 .fRimgfile   Enter image filename: _______________________________________________________ {Browse...}

 .fRmsg       [ ..........  Messages go here, in a label widget ..................................... ]

 .fRimage     -----------------------------------------------------------------------------------------
              |                                                                                       A
              |                                                                                       |
              |            [The image is put on this (scrollable) canvas.]                            |
              |                                                                                       |
              |                                                                                       |
              |                [The user picks points on this image.]                                 |
              |                                                                                       |
              |            [This canvas has horizontal and vertical scrollbars                        |
              |                   --- to accomodate very large images.]                               |
              |                                                                                       |
              |                                                                                       V
              <--------------------------------------------------------------------------------------->
|
Perhaps some aspects of the sketch could use a little more explanation: |
  A combination of VERTICAL-BAR CHARACTERS AND HYPHEN (or UNDERSCORE)
  CHARACTERS, that outline a RECTANGULAR SHAPE, are used to indicate
  either a Tk 'canvas' widget or a Tk 'listbox' widget or a Tk 'text' widget.

  A LINE (HYPHENS or VERTICAL-BARS) WITH AN 'ARROW-HEAD' AT EACH END
  indicates a Tk 'scale' widget --- or a 'scrollbar' widget.

  SCROLL-BAR 'ARROW-HEADS' (for a 'canvas', 'listbox', or
  'text' Tk widget) re drawn as follows:

   UP    ARROW-HEAD   is drawn with a CAPITAL-A.
   DOWN  ARROW-HEAD   is drawn with a CAPITAL-V.
   LEFT  ARROW-HEAD   is drawn with a LESS-THAN sign.
   RIGHT ARROW-HEAD   is drawn with a GREATER-THAN sign.

  UP-and-DOWN    ARROW-HEADS  at the right/left of a box shape
  indicate a VERTICAL SCROLL-BAR there.

  LEFT-and-RIGHT ARROW-HEADS  at the bottom/top of a box shape
  indicate a HORIZONTAL SCROLL-BAR there.

  The arrow-heads on a horizontal scrollbar are joined by hyphens,
  rather than underscores.
|
From the diagram above, you can see that this GUI will contain about:
Assembling the pieces (The GUI) Now it was a matter of putting the pieces together. I took 'code-pieces' from some of my other Tk scripts that 'draw' points (ovals) on an image placed on a Tk canvas --- in particular, from my 'Grid Warp an Image' tkGooie script. I ended up with the following GUI as an initial display, when the GUI is started up. |
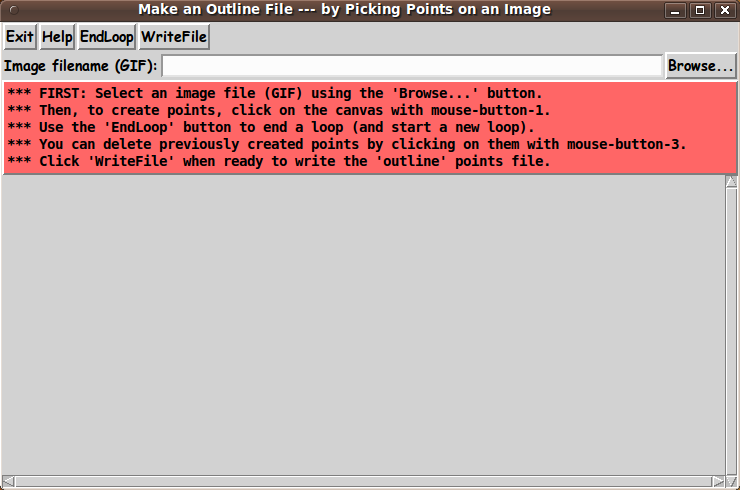
|
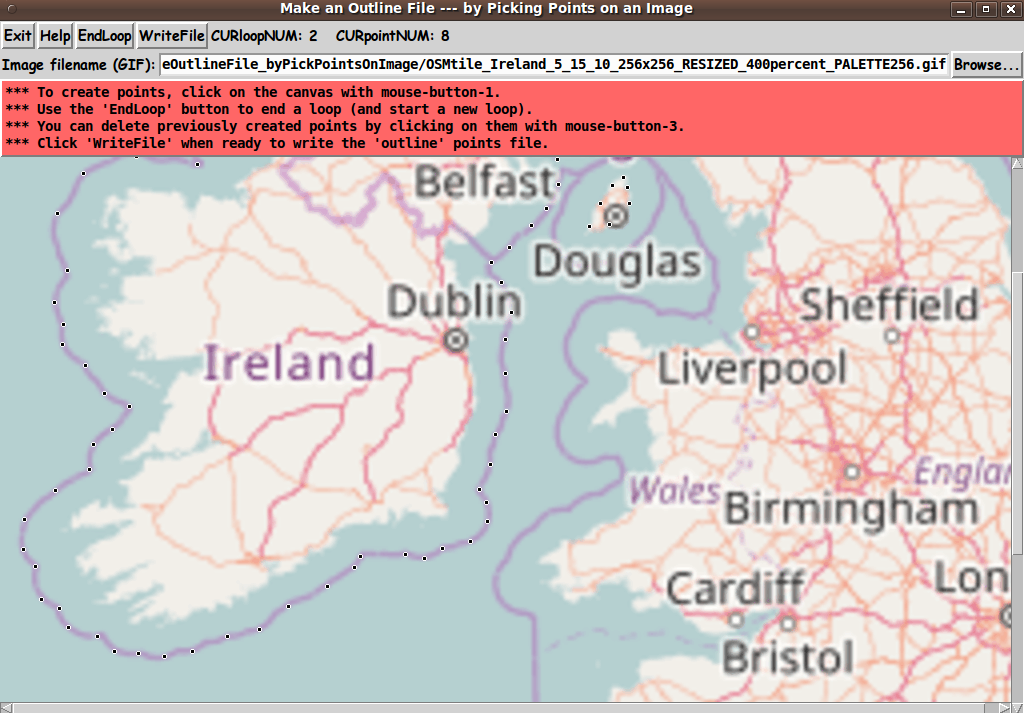
Note that the GUI starts up with no image file specified and an empty 'canvas' area at the bottom of the script --- although you can see the horizontal and vertical scrollbars at the bottom and right-side of the canvas area (to handle very large images). The message lines just below the filename entry field indicate that the first step for the user is to choose an image file to load onto the canvas. In my case, I am using the 8.5 version of the Tcl-Tk 'wish' interpreter --- which supports loading GIF files to the canvas, but not PNG files. If you have version 8.6 (or above) of the 'wish' interpreter, you can load PNG files to the canvas. There are shell scripts in the 'IMAGEtools' group of the 'FE Nautilus Scripts' subsystem that can be used to convert JPEG files to PNG or GIF files. And, if necessary, there are scripts there --- based on the ImageMagick 'convert' command --- that can be used to convert PNG files to GIF files (if you have Tcl-Tk 8.5, and not 8.6).. The following image indicates that I used the 'Browse...' button to find a GIF file that provides a map of Ireland and some surrounding area. It is an OSM (Open Street Map) tile image that has been increased in size by a factor of 4 (and converted from a PNG file to a GIF file). |

|
The message lines in the image above indicate that the user can begin to pick points on the image --- and, in fact, the top line of the GUI shows that 78 points have been picked in 'loop 1' on this image. (See the 'status' message on the right of the 'WriteFile' button.) The picked points are indicated by the little black 'ovals' (filled circles) with a white outline around them. (By using both black and white to indicate the points, it is likely that you will be able to see the points no matter what colors are on the image behind the points.) If the user wants to delete some points, simply click on any point to be deleted (that is, a point not to be written to the output file) by clicking on the point with MouseButton3 (a 'right-click'). Be aware however, that when returning to the process of picking points, after deleting one or more points, one should start picking points near where one last picked a point (if you need to finish a loop). This is because the points will be written to the output file in the order in which they were picked. The following image indicates that a new 'loop' has been started --- by clicking on the 'EndLoop' button and starting to pick points for a new loop. (See the 'status' message next to the 'WriteFile' button. It indicates that points are being picked for 'loop 2'.) |
|
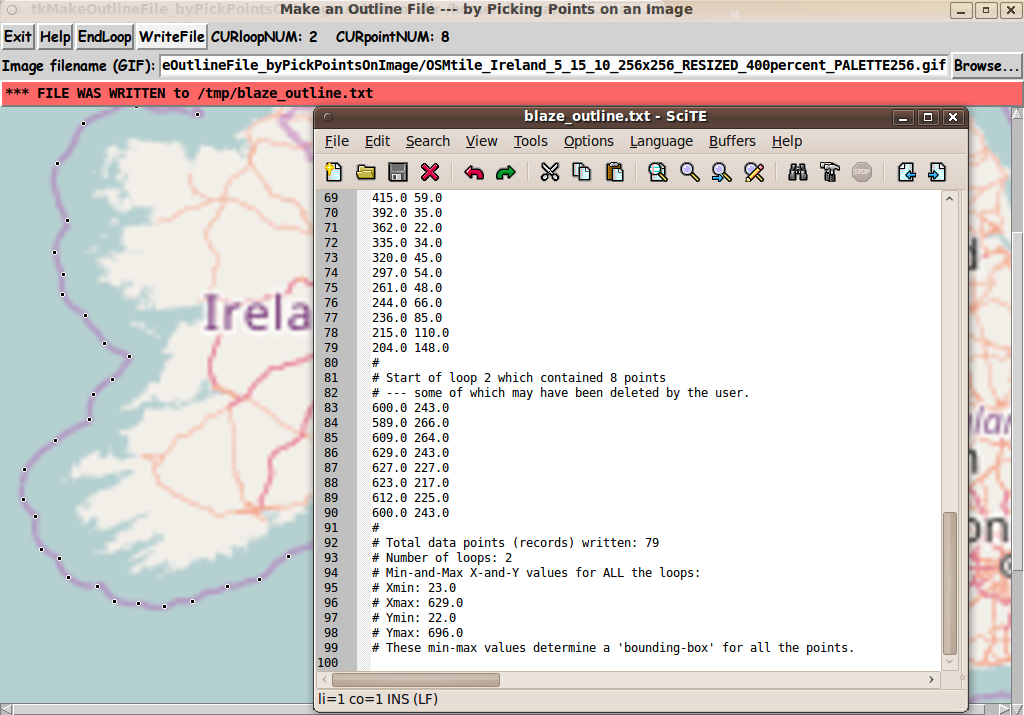
The points in 'loop 2' are around that little island to the upper right of Ireland. The image below shows what happens when you click the 'WriteFile' button:
|
|
The 'loops' are simply indicated in the 'outline-data' file by at least one comment or empty line separating one 'loop' from another 'loop'. Note that there is a variable 'TEXTeditor' that is 'set' at the bottom of this script. The user can change that setting to specify a text editor of their choice. Examples: /usr/bin/gedit OR /usr/bin/scite At this point, the user could use the 'tkGooie' 'tkReadOutlineFile_ drawOutlineOnCanvas' to draw a colored outline (or color-filled area) on a colored canvas background --- from this outline file. If the user decides that this 'outline-data' file is a 'keeper', the user can move the file to a 'non-temporary' directory --- and change the filename to a more meaningful name. --- These last few images show that the scrollbars on the canvas area are useful when dealing with a very large image file. DESCRIPTION OF THE CODE Below, I provide the Tk script code for this 'tkMakeOutlineFile_ byPickPointsOnImage' 'app'. I follow my usual 'canonical' structure for Tk code, for this Tk script: |
  0) Set general window & widget parms (win-name, win-position,
     win-color-scheme, fonts, widget-geometry-parms,
     text-array-for-labels-etc, win-size-control).

  1a) Define ALL frames (and sub-frames, if any).
  1b) Pack   ALL frames and sub-frames.

  2) Define & pack all widgets in the frames, frame by frame.
              Within each frame, define ALL the widgets.
              Then pack the widgets.

  3) Define keyboard and mouse/touchpad/touch-sensitive-screen action
     BINDINGS, if needed.

  4) Define PROCS, if needed.

  5) Additional GUI initialization (typically with one or more of
     the procs), if needed.
|
This Tk coding structure is discussed in more detail on the page A Canonical Structure for Tk Code --- and variations. This Tk coding structure makes it easy for me to find code sections --- while generating and testing a Tk script, and when looking for code snippets to include in other Tk scripts (code re-use). I call your attention to step-zero. One new thing that I started doing around 2014 is using a text-array for text in labels, buttons, and other widgets in the GUI. This can make it easier for people to internationalize my scripts. I will be using a text-array like this in most of my scripts in the future. All the 'set' statements for the text array, 'aRtext', are in one contiguous section toward the top of the code. Experimenting with the GUI As in all my scripts that use the 'pack' geometry manager (which is all of my 100-plus Tk scripts, so far), I provide the four main 'pack' parameters
on all the 'pack' commands for the frames and widgets. I think I have found a good setting of the '-side', '-anchor', '-fill', and '-expand' parameters on the 'pack' commands for the various widgets of this GUI. In particular ... The 'canvas' widget (and its scrollbars) will expand/contract appropriately when the GUI window size is resized --- while button widgets stay fixed in size and relative-location as the window size changes. The filename 'entry' widget and a couple of 'label' widgets will x-expand/contract appropriately when the GUI window size is changed in the x-direction. If anyone wants to change the way the GUI configures itself as the main (top-level) window size is resized, they can experiment with the '-side', '-anchor', '-fill', and '-expand' parameters on the 'pack' commands for the various widgets --- to get the widget behavior that they want. --- Additional experimentation with the GUI: You could change the fonts used for the various GUI widgets. For example, you could change '-weight' from 'bold' to 'normal' --- or '-slant' from 'roman' to 'italic'. Or change font families. In fact, you may NEED to change the font families, because the families I used may not be available on your computer --- and the default font that the 'wish' interpreter chooses may not be very pleasing. Furthermore, there are variables used to set geometry parameters of widgets --- parameters such as border-widths and padding. And you could change the '-relief' values for frames and widgets. Feel free to experiment with those 'appearance' parameters as well. Some features of the code There are plenty of comments in the code to describe what most of the code-sections are doing. See the top of the 'PROCS' section of the script for a list of the procs used in this Tk script. See comments in the procs for details on the purpose of each proc and for details on the methods by which each proc was implemented. There are some comments in the 'pointCreate' and 'end_loop' procs that describe various Tcl arrays that are used to hold x,y data and information about the points and loops. Here is a quick overview of the procs --- with an indication of how they are 'triggered': |
  - 'get_imgFilename'           - Called by the 'Browse...' button.

  - 'load_imagefile_to_canvas'  - Called by the 'get_imgFilename' proc.

  - 'set_scrollregion_size'     - Called by the 'load_imagefile_to_canvas' proc.

  - 'pointCreate'               - Called by a binding on the canvas widget.

  - 'pointDelete'               - Called by a binding on the canvas widget.

  - 'end_loop'                  - Called by the 'EndLoop' button.

  - 'write_file'                - Called by the 'WriteFile' button.

  - 'advise_user'               - Called in the 'Additional GUI Initialization'
                                  section at the bottom of this script to
                                  put an initial message in frame '.fRmsg' ---
                                  and called by various procs such as 'write_file'.

  - 'update_status'             - Called by the 'pointCreate' and 'end_loop' procs.

  - 'popup_msgVarWithScroll'    - Called by the 'Help' button ---
                                  and MAY be called by the various procs
                                  including the 'advise_user' proc.
|
A fervent hope It is my hope that the copious comments in the code might help Tcl-Tk coding 'newbies' get started in making GUI's like this. Without the comments --- especially in the 'pointCreate' proc --- the code might look even more cryptic than it already is. Without the comments, potential young Tcler's might be tempted to return to their iPhones and iPads and iPods --- to look for videos of animals (including humans) doing funny (or gross) things. To help out in making Tk scripts like this, here is a page that provides sources of Tcl-Tk code snippets by providing links to various 'tkGooies' scripts that can make it relatively quick work to compose
And when you get to the testing-and-debugging phase in development of a Tk script, here is a page that describes the wonderfulness of the 'wish' 'stack trace' facility, which can make the testing-and-debugging go relatively quickly and painlessly. The Tk Script CODE Here is a link to CODE for the Tk script 'tkMakeOutlineFile_ byPickPointsOnImage.tk'. To browse the code, click on the link. To download it : With your web browser, you can 'right-click' on this link --- and in the menu that pops up, select an item like 'Save Link Target As ...' --- to save this file to your local computer. Then you can rename the file to remove the '.txt' suffix. Make sure that you have execute permission set on the file --- in order to execute the script. |
|
Some possible FUTURE ENHANCEMENTS There are some enhancements that could be considered for this script, such as:
Since I have not used this script for a large number of tests with widely varying images and applications, there are probably some other enhancements (and fixes) that may be suggested by further usage. If I ever find that I am using this utility and I find that any of the features above are highly advisable to add or change (or implement in a different script), then I may return to this script to add/change/implement that feature. --- The bottom line here is that there are almost always enhancements that could be made to (or 'forks' that could be made from) a Tk GUI 'app' like this. One advantage of this Tk script is that it is 'open' code --- available to anyone for enhancement. So if you would like to take a different approach to implementing this script, you are welcome to take this code and build on it (or reconstruct it). IN CONCLUSION As I have said on other code-donation pages on this site ... There's a lot to like about a utility that is 'free freedom' --- that is, no-cost and open-source so that you can modify/enhance/fix it without having to wait for someone else to do it for you (which may be never). A BIG THANK YOU to Ousterhout for starting Tcl-Tk, and a BIG THANK YOU to the Tcl-Tk developers and maintainers who have kept the simply MAH-velous 'wish' interpreter going. |
|
Bottom of this web page that To return to a previously visited web page location, click on the Back button of your web browser a sufficient number of times. OR, use the History-list option of your web browser. OR ...
< Go to Top of Page, above. >Page history:
This FE web page was created 2017 Oct 12.
NOTE: |