FE 'tkGooie' Utilities

'ODEtools' group
of the
'MATHtools' group

Tool to Simulate a
Single Pendulum

(No Friction)
(including an animation
on a Tk 'canvas')
(FE = Freedom Environment)

FE tkGooie interface to
simulate a pendulum ---
even a wide-swinging one.

Larger, hi-res image is below.

FE Home Page > FE Downloads Page >

FE 'tkGooies' Description Page >

FE 'tkGooies' 'MATHtools' Page >

FE 'tkGooies' 'ODEtools' Page >

This
'tkSimulateSinglePendulumNoFriction'
tkGooie Page

INTRODUCTION to Tcl-Tk script
'tkSimulateSinglePendulumNoFriction'

For at least 5 years now (about 2011 to 2016), I have had it on my Tk-scripts-to-do list to implement a GUI that performs numerical-integration of the ODE's (ordinary differential equations) that describe some dynamic physics configurations of classical mechanics

--- such as the differential equations describing the angular displacement (and velocity), over time, of an oscillating pendulum.

To start off relatively simply, I wanted to simulate a single pendulum suspended from a fixed pivot-point (Wikipedia link).

But I wanted to allow for simulating the motion of a wide-swinging pendulum --- which means doing numerical integration of a nonlinear differential equation --- of the form


   D(D(u)) = -g/L * sin(u)

   where D represents the time-derivative operator d/dt,

     and t represents the time independent variable,

     and u represents the angular displacement of the
           pendulum arm from vertical,

     and g is the acceleration due to gravity (on Earth or
           the Moon or Mars or a mountain-top or whatever),

     and L is the length of the pendulum arm (the distance
           to a heavy mass at the end of the arm, where
           the mass is so great that the weight of the
           arm is negligible --- or L is the distance
           from the fixed-pivot-point to the center-of-mass
           of the arm and the mass at the end of the arm).


It has been well-known for more than two hundred years (with credits going to Galileo, Huygens, Newton, Leibniz, the Bernoulli's, Euler, and others for early quantitative observations on pendulums) that if you restrict your attention to a pendulum whose swinging is restricted to a small angle

--- for example, by displacing the pendulum bob a small angle from its lowest position and letting go

--- then the following differential equation can be used to approximate the motion of the pendulum that is oscillating with a 'gentle' swing.

D(D(u)) = -g/L * u

where sin(u) is replaced by u

And it became well known that the general solution of this 'linear' equation can be written in the form

A * sin(w*t) + B * cos(w*t)

where the coefficient w = sqrt(g/L) and where the constants A and B can be determined from two initial conditions (inital angular displacement and initial angular velocity).

    (Note:
    I am using 'sqrt' to denote the square root function.)

'2pi/w' is the period, T, of the oscillation, where T is in units like seconds per cycle.

The reciprocal of T is the cycles per second --- the frequency.

So the frequency, f, is 1/T = w/2pi.

Thus the solution can be written

A * sin(2pi*f*t) + B * cos(2pi*f*t)

or

A * sin(2pi*t/T) + B * cos(2pi*t/T)

An expression of the form

A * sin(k*t) + B * cos(k*t)

can be written in the form

C * sin(k*t + D)

where the constant D is called a 'phase angle'.

Hence the solutions to the 'linear' pendulum equations are sinusoidal.

And one can expect the solutions to the more general 'nonlinear' equations to be similar to sinusoidal functions.

But there is no 'nice' math expression for the general solutions to the nonlinear problem --- for example, in terms of (a finite number of) trigonometric functions or polynomials.

So, in this Tk GUI utility, we use numerical integration to generate solutions to the 'nonlinear' differential equation --- at discrete points in time.


GOALS for the GUI

I had the following goals in mind for the GUI.

The GUI should allow the user to enter various values for g and L.

    (Note that the equation for angular acceleration does not involve mass --- the mass factors cancelled out during derivation of the equation.

    So the angular motion of the friction-less pendulum should be the same whether the mass is 10 kg or 20 kg, for example.

    Bottom line:
    We do not have to prompt for mass on the GUI.)

The GUI should also allow the user to enter parameters for the solver process:

  • an initial angular displacement from vertical

  • an initial angular velocity (typically zero)

  • an end-time for the end of the solution process

  • a time-step, h, for the solution process.

AND --- following a solution run, the GUI should also allow the user to start (and stop) an animation of a pendulum drawn on a Tk canvas.

The animation is to be shown on a square Tk 'canvas' widget by using 'create line' and 'create oval' and 'delete' commands on the Tk canvas.

---

To evaluate any further requirements that we may need for the GUI, it is helpful to know some of the details of

  • the method of numerical integration of the differential equation

  • the method of implementing the animation

Some details follow.


METHOD - MATH MODELLING OF THE PENDULUM MOTION :

To make the problem compatible with numerical integration methods, we convert the single 'second order' differential equation

D(D(u)) = -g/L * sin(u)

to two 'first order' differential equations with u (= u1 = displacement) and D(u) (= u2 = velocity) being functions of t to be generated by integrating these 2 'first-order' differential eqns:

      D(u1) = u2
      D(u2) = -g/L * sin(u1)

starting at initial conditions u1=A and u2=B, where A is an initial angle and B is an initial angular velocity.

The common way of expressing these kinds of systems of first order differential equations in compact, general form is

D(u) = f(t,u)

where u and f are N-dimensional vectors.

This is a compact way of expressing a system of scalar differential equations:

D(u1) = f1(t,u1,...,uN)
D(u2) = f2(t,u1,...,uN)
. . . . . . . . . . .
D(uN) = fN(t,u1,...,uN)

In the case of these pendulum equations, N=2, and we can think of solving for the unknown function vector

(u1(t),u2(t))

where the right-hand-side (RHS) of the two scalar pendulum differential equations above can be thought of as a special case of a more general user-specified function vector

(f1(t,u1,u2),f2(t,u1,u2))

where

f1(t,u1,u2) = u2

f2(t,u1,u2) = -g/L * sin(u1).

We use the popular Runge-Kutta 4th order method (RK4) to perform the numerical integration for a user-specified time step, h.

We basically use two procs to perform the integration steps:

  • a proc to perform the RK4 integration for N=2 --- giving the values of (u1,u2) for each time step

  • a proc to evaluate the RHS functions (f1,f2) for specified values of t,u1,u2.

The latter proc ('deriv', say) is called several times by the former proc ('rk4', say), for each time step.


METHOD - PLOTTING THE ANIMATION ON THE TK CANVAS :

After a solution, we have the solution functions u1 and u2 for a sequence of (equally-spaced) time values.

    We could use a more complex Runge-Kutta method --- such as Runge-Kutta-Fehlberg --- to get a solution with potentially unequally-spaced time values.

We use function u1 (angular displacement) to do the animation.

For each time value, t(i), the pendulum is drawn as a simple

  • line-segment representing the 'arm' of the pendulum

  • color-filled circle representing the mass at the end of the (essentially weight-less) arm.

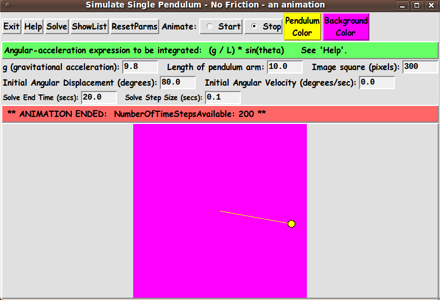
Our GUI provides 2 buttons by which the user can specify 2 colors for:

  • the canvas background

  • the pendulum components (line and circle).

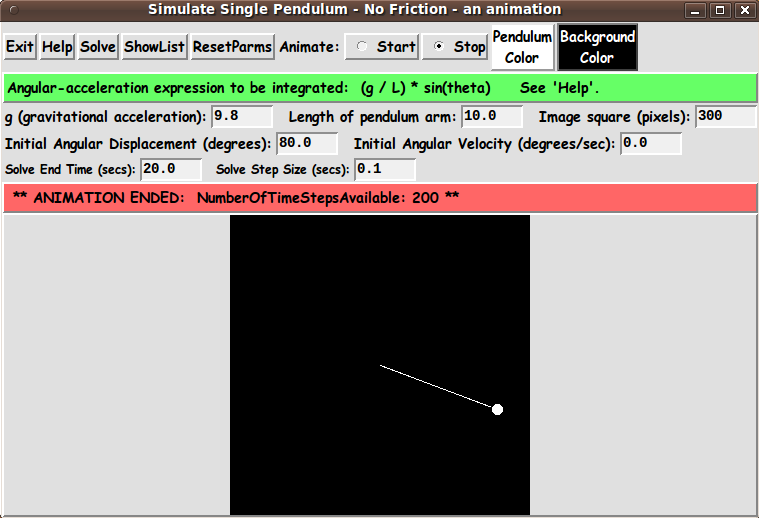
An 'animate' proc performs the pendulum animation when the user clicks on a 'Start' radiobutton of the GUI.

This 'animate' proc uses the 'world-coordinates' --- the values of angle u1 --- to draw the swinging pendulum within an square area of about 2*L by 2*L in world coordinates, where L is the length of the pendulum arm.

We think of the pivot-point of the pendulum as being at the origin --- (0.0,0.0).

We use the angle u1 to compute the x,y coordinates of the end of the pendulum arm (and center of the mass, represented by a circle).

The 2Lx2L area allows for the pendulum to swing to extremes:

  • a horizontal arm to the left or right of the pivot-point

  • the pendulum arm hanging down below the pivot-point
    (zero degrees displacement)

  • the pendulum arm displaced above the pivot-point
    (say, plus or minus 180 degrees displacement).

A proc is provided which maps the plot area limits in world coordinates --- say

UpperLeftCorner: (-L,+L)
LowerRightCorner: (+L,-L)

to the corners of the plot area in pixel coordinates:

UpperLeftCorner: (0,0)
LowerRightCorner: (ImageWidthPx,ImageHeightPx)

We use a value a little larger than L for the world coordinate limits --- to allow for a little margin around the swinging pendulum.

To get a square image area, we use ImageWidthPx=ImageHeightPx and we determine this number of pixels by allowing the user to specify the integer value in an entry widget on the GUI.

The 'animate' proc uses 2 procs --- 'Xwc2px' and 'Ywc2px' --- to convert the world coordinates of each point --- such as the end-point(s) of the pendulum arm --- to pixel coordinates.

The pixel-coordinates are used in the 'create line' and 'create oval' commands to redraw the pendulum-arm and mass (represented by a circle) for each time step.
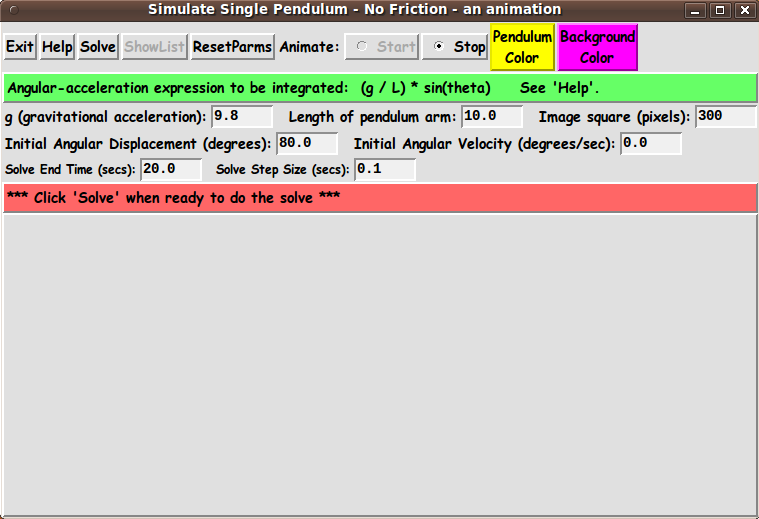

THE GUI LAYOUT :

Based on the notes above, the Tk GUI should allow the user to specify

  • g   (gravitational acceleration at Earth's surface)

  • L   (length of the pendulum)

  • initial-angle

  • initial-angular-velocity

  • solver time-step-size

  • an end-time for the simulation

There is to be a 'Solve' button to perform a solution when the user is ready to use these parameters.

A 'ShowList' button can be used to show the list of solution values --- triplets t(i), u1(t(i)), u2(t(i)) --- in a popup window.

    We allow the user to specify the two intial values in degrees, rather than radians --- initial angular displacement in degrees and initial angular velocity in degrees/sec.

    These two values are converted to radians for easy and efficient use in the Tcl sin() function of the solve process.

    We can add 2 columns to the list output, to show u1 and u2 in degrees, as well as in radians.

There are 2 buttons on the GUI by which to call up an RGB-color-selector GUI with which to specify the 2 colors for the animation drawing on the canvas.

In addition, on the GUI, there are 'Start' and 'Stop' radiobuttons to start and stop an animation run.

---

To allow the user to speed-up or slow-down the animation, there could be a Tk widget ('entry' or 'scale') by which to specify a wait-time (in millisecs) between computing and displaying each new pendulum position.

This would be an alternative to using a wait-time value computed according to the solution step-size, h --- which is set by the user, in an 'entry' widget on the GUI.

For now, we may simply calculate the animation wait-time based on the time-step, h.

---

One way the user can specify all these parameters is indicated by the following 'sketch' of a layout for the GUI.

In the following sketch of the GUI:


   SQUARE BRACKETS indicate a comment (not to be placed on the GUI).
   BRACES          indicate a Tk 'button' widget.
   UNDERSCORES     indicate a Tk 'entry' widget.
   A COLON         indicates that the text before the colon is on a 'label' widget.
   CAPITAL-O       indicates a Tk 'radiobutton' widget.
   CAPITAL-X       indicates a Tk 'checkbutton' widget (if any).
   Vertical bars (and horizontal hyphens) outline a 'canvas' widget.
   
   If there are scrollbars:
   Less-than and greater-than signs indicate the left and right ends of a horizontal 'scrollbar'.
   Capital-V and Capital-A letters indicate the bottom and top ends of a vertical 'scrollbar'.


Here is the sketch:


FRAMEnames
VVVVVVVVVV
            ------------------------------------------------------------------------------------------
            Simulate Single Pendulum -- No Friction - an animation
            [window title]
            ------------------------------------------------------------------------------------------

.fRbuttons   {Exit} {Help} {Solve} {Show {Reset  Animate: O Start O Stop  {Pendulum   {Background
                                    List} Parms}                              Color}        Color}

.fRrhs       [ ........  Angular acceleration expression goes here, in a label widget  .......... ]
             (This could be an entry widget, someday, to allow for changes in the math expression.)

.fRparms     g (gravitational acceleration): 9.8__   Length of pendulum arm: 10.0__  Image square (pixels): 300__
             
.fRinit      Initial Anglular Displacement (degrees): 8.0__  Initial Angular Velocity (degrees/sec): 0.0___

.fRtimes     Solve End Time (secs): 20.0__   Solve Step Size (secs): 0.005__

.fRmsg       [ ..........  Messages go here, in a label widget .......................... ]

.fRcanvas    |------------------------------------------------------------------------|
             |                                                                        |
             |                                                                        |
             |     [This area is to contain a non-scrollable square canvas widget     |
             |      in which the animation is to be drawn.                            |
             |                                                                        |
             |      The square canvas widget is centered at the top of this area.]    |
             |                                                                        |
             |                                                                        |
             |                                                                        |
             |                                                                        |
             |------------------------------------------------------------------------|


GUI components:

From the GUI 'sketch' above, it is seen that this GUI layout consists of about

  • 7 button widgets
  • 10 label widgets
  • 7 entry widgets
  • 1 canvas widget with no scrollbars
  • 2 radiobutton widgets in 1 group
  • 0 scale widgets (but may use scale widgets in place of some entry widgets)
  • 0 checkbutton widgets
  • 0 listbox widgets
  • 0 text widgets

The GUI (a screenshot)

To implement this Tk GUI script, I fetched one of my Tk scripts that had most of these GUI elements and converted it to this 'tkSimulatePendulumNoFriction' script.

I ended up with the GUI seen in the following image.

This is the GUI as it first appears.

As the message in the middle of the GUI indicates, the user can take the defaults for all the parameters and simply click on the 'Solve' button to do the numerical integration.

The first time I ran the solve-process (after fixing a bunch of syntax errors in the code), I was astonished at how quickly the solve completes --- in a fraction of a second!

A 'solve completed' message appeared in the message area so quickly after I clicked on the 'Solve' button, I thought that the code did not execute all the mathematical operations for all the time steps.

The 'SOLVE DONE' message said that the elapsed time for the solve was 60 milliseconds --- less than one-tenth of a second for 200 time-steps of integration.

Not bad, considering I have not expended time trying to obtain the optimum speed out of all the numerical integration code.

When I clicked on the 'ShowList' button, a list of the computed results --- time, angular-displacement in radians, angular-velocity in radians per second, angular-displacement in degrees, angular-velocity in degrees per second --- appeared for the 200 time steps and corresponded to the default initial conditions.

---

Note that you can use the 'ShowList' button to generate columns of decimal numbers that can be copied-and-pasted into a text-editor window.

The text editor can be used to save the data to a text file.

Then that text file can be edited (to remove or comment out the header and trailer text) and fed into a 'tkGooie' XY-function plot utility such as

tkGnuplotXY_2or3colsFromFile

to get a plot of the displacement and velocity functions (in radians or degrees).

---

To give you an idea of what the animation image area looks like, here is a 'screenshot'.

Before clicking the 'Start' button for this animation, I used the 2 color buttons to call up a color selector GUI to set the pendulum color to white and the background color to black.

The reduced-size screenshot at the top of this page shows the image area in the default colors --- yellow for the pendulum arm-and-mass and magenta for the background.

---

HELP TEXT

The 'Help' button on the GUI shows extensive text describing this utility, in a popup window with scrollbars for the text area.


DESCRIPTION OF THE CODE

Below I provide a link to the Tk script code for this 'tkSimulatePendulumNoFriction' utility.

For this Tk script, I follow my usual 'canonical' structure for Tk code:


  0) Set general window & widget parms (win-name, win-position,
     win-color-scheme, fonts, widget-geometry-parms, win-size-control,
     text-array-for-labels-etc).

  1a) Define ALL frames (and sub-frames, if any).
  1b) Pack   ALL frames and sub-frames.

  2) Define & pack all widgets in the frames, frame by frame.
     Within each frame, define ALL the widgets. Then pack the widgets.

  3) Define keyboard and mouse/touchpad/touch-sensitive-screen action
     BINDINGS, if needed.

  4) Define PROCS, if needed.

  5) Additional GUI initialization (typically with one or more of
     the procs), if needed.


This Tk coding structure is discussed in more detail on the page A Canonical Structure for Tk Code --- and variations.

This structure makes it easy for me to find code sections --- while generating and testing a Tk script --- and when looking for code snippets to include in other scripts (code re-use).

I call your attention to step-zero.

One thing that I started doing in 2013 is using a text-array variable --- named 'aRtext' --- for text in labels, buttons, and other widgets in the GUI.

This can make it easier for people to internationalize my scripts.

I will be using a text-array like this in most of my scripts in the future.


Experimenting with the GUI

As in all my scripts that use the 'pack' geometry manager (which is all of my 100-plus scripts, so far), I provide the four main 'pack' parameters

  • '-side'
  • '-anchor'
  • '-fill'
  • '-expand'

on all of the 'pack' commands for the frames and widgets.

That helps me when I am initially testing the behavior of a GUI (the various widgets within it) as I resize the main window.

I think that I have used a nice choice of the 'pack' parameters.

In particular ...

The labels and buttons and entry widgets stay fixed in size and relative-location as the window is re-sized --- while the area containing the 'canvas' can expand/contract as the window is re-sized.

You can experiment with the '-side', '-anchor', '-fill', and '-expand' parameters on the 'pack' commands for the various frames and widgets --- to get the widget behavior that you want.

---

Additional experimentation with the GUI:

You might want to change the fonts used for the various GUI widgets.

For example, you could change '-weight' from 'bold' to 'normal' --- or '-slant' from 'roman' to 'italic'.

Or change font families.

In fact, you may NEED to change the font families, because the families I used may not be available on your computer --- and the default font that the 'wish' interpreter chooses may not be very pleasing.

I use variables to set geometry parameters of widgets --- parameters such as border-widths and padding.

And I have included the '-relief' parameter on the definitions of frames and widgets.

Feel free to experiment with those 'appearance' parameters as well.

---

Note that the color buttons call on a color-selector-GUI script to set the colors.

You can make that color-selector script by copying-and-pasting the code from the page offering 'a non-obfuscated color selector GUI', on this site.

Some comments and code at the bottom of this 'pendulum animation' Tk script explain how you can implement the RGB color selector script.


Some features in the code

There are plenty of comments in the code, to describe what most of the code-sections are doing.

You can look at the top of the PROCS section of the code to see a list of the procs used in this script, along with brief descriptions of how they are called and what they do.

---

Here is a brief overview of the procs of the script.


    - 'solve'                    - called by the 'Solve' button.

    - 'runge-kutta-4'            - called by the 'solve' proc.

    - 'deriv'                    - called by the 'runge-kutta-4' proc.

    - 'show_list'                - called by the 'ShowList' button

    - 'animate'                  - called by a click on the 'Start' animation radiobutton.

    - 'setMappingVars_for_px2wc' - called by proc 'animate'.

    - 'Xwc2px'                   - called by proc 'animate'.
    - 'Ywc2px'                   - called by proc 'animate'.

    - 'set_pendulum_color1'      - called by the 'PendulumColor' button.

    - 'set_background_color2'    - called by the 'BackgroundColor' button.

    - 'update_color_button'      - sets background & foreground color of
                                   either of the 2 color buttons ---
                                   called by the 2 'set_*_color*' procs and in the
                                   'Additional GUI Initialization' section,
                                   to initialize colors on the 2 color buttons.

    - 'advise_user'              - called by the 'solve' and 'animate' procs.

    - 'reset_parms'              - called by the 'ResetParms' button and in the
                                   'Additional GUI Initialization' section,
                                   to initialize the parms.

    - 'edit_inputs'              - called by 'solve' and 'animate' procs

    - 'decimal_check'            - called by 'edit_inputs' proc

    - 'popup_msgVarWithScroll'   - called by the 'Help' button.


The main numerical integration code is in the 'runge-kutta-4' and 'deriv' procs.

See the comments in those procs for details on their implementation.


A fervent hope

It is my hope that the copious comments in the code will help Tcl-Tk coding 'newbies' get started in making GUI's like this.

Without the comments, potential young Tcler's might be tempted to return to their iPhones and iPads and iPods --- to find

  • videos of Donald Trump telling us how brilliant he is (far more brilliant than George Washington and Thomas Jefferson and Vladimir Putin, I take it)

    and

  • videos of Hillary Clinton telling us things about computer servers and emails that any person familiar with computer technology knows cannot be true.

A recent (2016) poll asked people whether they preferred

  • Donald Trump as president

  • Hillary Clinton as president

  • a massive meteor strike on Earth.

13 percent of the respondents opted for the meteor strike.

That would be my vote too.

But if that happens, then all my work on these Tk scripts will be for naught --- unless the insects that survive the strike evolve into beings with advanced intellect who manage to learn to read the digital and paper text remnants that might survive the meteor strike --- and re-invent computers and Tcl-Tk.


The Tcl-Tk CODE :

Here is a link to CODE for the script

'tkSimulateSinglePendulumNoFriction.tk'.

With your web browser, you can 'right-click' on this link --- and in the menu that pops up, select an item like

'Save Link Target As ...'

--- to save this file to your local computer.

Then you can rename the file to remove the '.txt' suffix.

Make sure that you have execute permission set on the file --- in order to execute the script.


SOME POTENTIAL ENHANCEMENTS:

I ran across a document on differential equations that presented a table that summarizes some of the single-pendulum problems and their second-order differential equations.

The table looked like this:

  1. Linear Pendulum :
    D(D(u)) = -(g/L)*u

  2. NonLinear Pendulum :
    D(D(u)) = -(g/L)*sin(u)

  3. Damped Linear Pendulum :
    D(D(u)) = -(g/L)*u - k*D(u)

  4. Damped NonLinear Pendulum :
    D(D(u)) = - (g/L)*sin(u) - k*D(u)

  5. Forced Damped Linear Pendulum :
    D(D(u)) = -(g/L)*u - k*D(u) + F*cos(W*t)

  6. Forced Damped NonLinear Pendulum :
    D(D(u)) = -(g/L)*sin(u) - k*D(u) + F*cos(W*t)

(The damping is linear in these.)

This table suggests some features that I may add to this Tk script --- or implement in a separate Tk script:

  • LINEAR and NON-LINEAR with the same GUI:

    Add a pair of radiobuttons to the GUI, to allow the user to choose whether to numerically integrate the NON-LINEAR problem or the LINEAR problem --- items 2 or 1 in the list above.

  • GENERATE THE LINEAR SOLUTION with the sin() function:

    The solution of the linear problem can be expressed as a sin() function like

    A*sin(w*t + B)

    where w is sqrt(g/L) and the constants A and B can be determined for the user-specified initial conditions (initial displacement and velocity).

    As an enhancement to the 'ShowList' option, it would not be hard to add 2 columns (or 4, for degrees as well as radians) showing the displacement and velocity as computed from the expression

    A*sin(w*t + B)

    --- thus giving the solution to the linear problem via the 'ShowList' option.

    The user could paste the list of columns of results in a file and use the file to generate comparison plots of the non-linear and the linear solutions --- by using a plot utility like 'gnuplot'.

  • PROVIDE FOR THE DAMPED and FORCED CASES:

    Additional widgets could be added to the GUI to allow for adding the parameters for solving the damped and forced equations --- such as the equations in items 3,4,5,6 in the list above.

  • ALLOW FOR SPECIFYING THE RHS MATH EXPRESSION, instead of parameters:

    This GUI could be used for a wide variety of 'tweaks' to the math expression for the RHS (right-hand-side) of the second-order DE's in the list above.

    This could be accomplished by putting an 'entry' widget in place of the 'green' text line on the GUI --- the line that simply shows the RHS (right hand side) of the second-order DE that is to be solved.

  • PROVIDE A PLOT OPTION,
    to do an 'xy' plot of u and D(u) :

    We could add a 'Plot u,D(u)' button to the top of the GUI to enable using the canvas area of the GUI to do an 'xy' plot --- as well as using the area to do animations of the pendulum.

    The linear-equation solution, A*sin(w*t + B), could also be plotted.

    A new 'plot' proc (and associated procs) would need to be added.

    This would add a lot of code to this already-long Tk script --- but it might be worth it --- to make getting a plot image (of displacement and velocity as a function of time) as easy as 'falling off a log'.

  • A HIGHER-QUALITY IMAGE
    (with color-shaded edges,
    instead of 'jaggies') :

    It might take a lot more effort (and code), but the color-filled circle for the mass --- and the straight line for the 'arm' --- in the image-area could (conceivably) be created using the Tk 'image create photo' command.

    The Tk 'image create photo' command creates an 'in-memory' image structure, and that image could be placed on the Tk 'canvas' widget with a Tk-canvas 'create image' command.

    Then nice, color-shaded (anti-aliased) images of the mass and the arm could be rendered using 'put' commands on the in-memory image structure --- to assign hex-codes for RGB colors to the pixels of the image.

    A circle and a straight line --- with color-shaded edges --- could be created --- perhaps by using techniques that were used in the

    of the FE 'tkGooies' system.

    The rotation of the (anti-aliased/color-shaded) straight line might be performed by using code like the code that was used in the

    Rotate Image script

    of the FE 'tkGooies' system.

    It might be best to implement this as a separate, alternative 'tkGooie' script.

  • PROVIDE AN OPTION to
    SAVE AN ANIMATION
    as an ANIMATED GIF File

    (or as a movie file, such as a '.mp4' file).

    A 'WriteAniGIF' (or 'WriteMovie') button could be added to the GUI, and a technique like that used in the

    of the FE 'tkGooies' system could be used to make an animated GIF file.

    This enhancement would also add a lot of code to this already-long Tk script --- but it might be worth it --- to make capturing an animation as easy as 'falling off a log'.

---

There will probably more enhancements that I may think of in the future.

But some enhancements might be more suitable for putting in a separate Tk script using somewhat different equations or GUI design or methods.

---

For those who might want to go ahead and add enhancements:

To help out in making Tk scripts like this, here is

a page that provides sources of Tcl-Tk code snippets

by providing links to various 'tkGooies' scripts that can make it relatively quick work to compose

  • widget definitions,
  • bind statements, and
  • procedure code.

And when you get to the testing-and-debugging phase in development of a Tk script, here is

a page that describes the wonderfulness of the 'wish' 'stack trace' facility

which can make the testing-and-debugging go relatively quickly and painlessly.


IN CONCLUSION

There's a lot to like about a utility that is 'free freedom' --- that is, no-cost and open-source so that you can modify/enhance/fix it without having to wait for someone else to do it for you (which may be never).

I hope to provide more free scripts that can be used to demonstrate mathematical and physics principles (and Tk coding techniques) --- scripts that could be used in a classroom or self-teaching setting.

As I have said on other 'tkGooie' pages of this FE web site ...

A BIG THANK YOU to Ousterhout for starting Tcl-Tk, and a BIG THANK YOU to the Tcl-Tk developers and maintainers who have kept the simply MAH-velous 'wish' interpreter going.

Bottom of this page fo
presenting Tcl-Tk code for GUI
tkSimulateSinglePendulumNoFriction
--- a utility in the FE 'tkGooies' system,
in the 'ODEtools' subgroup
of the 'MATHtools' group.

To return to a previously visited web page location, click on the Back button of your web browser a sufficient number of times. OR, use the History-list option of your web browser.
OR ...

< Go to Top of Page, above. >

Page history:

This FE web page was created 2016 Jul 07.

This FE web page was changed 2016 Jul 23.
(Added to the 'Potential Enhancements' section --- and corrected some typos.)

This FE web page was changed 2016 Jul 30.
(Added links to 2 programming aid pages.)

Page was changed 2019 Mar 04.
(Added css and javascript to try to handle text-size for smartphones, esp. in portrait orientation.)

Page was changed 2019 Jun 28.
(Specified image widths in percents to size the images according to width of the browser window.)


NOTE:
This code and description has not been posted on a Tcler's Wiki page --- at wiki.tcl-lang.org --- formerly wiki.tcl.tk. If I ever do so, as a backup and alternative to this page, I plan to add a link to that Wiki page here.