FE 'tkGooie' Utilities

'PLOTtools' group

'tkGnuplotXY_
2or3colsFromFile'

a GUI 'front-end'
for 'gnuplot'

(FE = Freedom Environment)

An XY plot from an
FE 'tkGooie'
'frontend' to 'gnuplot'
---
to read 2 or 3 columns
from a text file
and do an XY or
X-Y1-Y2 plot

FE Home Page > FE Downloads Page >

FE 'tkGooies' Description Page >

FE 'tkGooies' 'PLOTtools' Menu >

This
'tkGnuplotXY_file2or3cols'
tkGooie description-and-code Page

INTRODUCTION to
Tcl-Tk code for a
'tkGnuplotXY_2or3colsFromFile' 'app'

On a tkPiePlot page of this site, I describe a personal commitment to donate about five 'PlotQuik' utilities (Tk scripts) to the Tcl-Tk wiki at wiki.tcl.tk.

Since it may be 2016 or so before I get around to making some auto-plot-scaling and auto-ticmarking code in those scripts more robust (and modular), I have decided to make some Tk GUI 'front-ends' for the popular, widely-available 'gnuplot' program --- some plot utilities for

  1. XY plots of 2 or 3 columns of data from a data file

  2. bar charts from a data file

  3. XY plots from math expressions of the form f(x)

  4. 3D surface plots from math expressions of the form g(x,y)

  5. one or two other 'gnuplot' front ends

I have written a Tk script for item 1 above, and the code is presented further below.


THE GOALS

I had some general goals for the Tcl-Tk 'front-end' script for this GUI.

Those goals were shaped by the capabilities of the 'gnuplot' program.

As I proceeded in the coding and testing, my knowledge of the capabilities of 'gnuplot' advanced, and some of my goals were augmented or altered.

Here are the main goals to which I gravitated.

  • Provide an entry field for a file name --- and a 'GetFilename' button --- to use the Tcl-Tk 'tk_getOpenFile' utility to provide a way to navigate a directory structure to select a data file.

  • Provide 3 entry fields so that the user can tailor the plot title, and the x-axis and y-axis titles, as desired.

  • Provide 3 entry fields so that the user can specify, by integer number, the data columns of the file to be used for the x-values and a y1-plot --- and an optional y2-plot on the same graph.

  • Provide a row of buttons at the top of the GUI with labels such as 'Exit', 'Help', 'RePlot', and several color buttons to allow for setting some color options that are available with 'gnuplot'.

  • Provide a checkbutton at the top of the GUI labelled something like 'Same Axis Units for Y1 and Y2' --- to, eventually, allow for the option to have a separate scale (min,max) for the Y2 data --- and, in that case, provide a y2-axis on the right side of the plot. But, for a first release, have that checkbutton set to 'Same Units' and grayed-out (disabled).

  • Provide 6 entry fields so that the user can specify min and max values for x, y1, and y2 --- with the min,max entry fields for y2 grayed-out (disabled), for now.

    So 4 of the min-max entry fields are enabled in the first release.

  • Provide radiobuttons for some of the output ('terminal type') options of 'gnuplot' --- GIF, PNG, JPEG, PS (Postscript), and SVG (Scalable Vector Graphics).

    In addition, provide a 'Test' button next to the radiobuttons, to take advantage of a 'gnuplot' ability to put out a 'test image' for any of the 'terminal types' --- showing the line-types and text orientation options and other options for the terminal type.

  • Provide 2 entry fields by which to specify the size of the image output (x-pixels, y-pixels).

  • Provide 3 radiobuttons by which to specify which type of plot to render: lines-only, point-symbols-only, or both lines-and-points.

  • Provide Y1 and Y2 entry fields by which to specify any of the 29 or so line types that 'gnuplot' provides.

  • Provide an X entry field, by which to specify a column of the file from which to fetch labels for the X axis tic-marks.

    Example labels:
    Oct2014, Nov2014, Dec2014, Jan2015, ..., Sep2015

    This reminds me --- I will probably have to provide an option on the GUI, someday, to rotate the X-tic-labels by 90 degrees or some other angle like -45 degrees.

    'gnuplot' supports this capability, for most of the 'terminal types'.


THE GUI LAYOUT

Like for some other Tk GUI scripts that I posted here, I made a 'text-sketch' for the GUI for this 'gnuplot' 'front-end' utility.


  CONVENTIONS for the GUI 'text-sketch' below:

   * SQUARE-BRACKETS indicate a comment not to be included on the GUI.
   * BRACES indicate a Tk 'button' widget.
   * UNDERSCORES indicate a Tk 'entry' widget.
   * A COLON indicates that the text before the colon is on a 'label' widget.
   * CAPITAL-O indicates a Tk 'radiobutton' widget.
   * CAPITAL-X indicates a Tk 'checkbutton' widget.


  Here is the sketch:


  FRAMEnames
  VVVVVVVVVV
              ------------------------------------------------------------------------------------------
              Gnuplot of 2 or 3 columns from a data file:
              [window title]
              ------------------------------------------------------------------------------------------

  .fRbuttons  {Exit} {Help} {Plot} {Color of      {Color of  {Color of        X SameAxisUnits for Y1,Y2
                                    Lines}         axes}      background}

  .fRfile      Data Filename: _______________________________________________  {Browse...}

  .fRtitle     Plot title: _____________________________________________________________________

  .fRxaxis      XColumn: 1__     XaxisMin ______  XaxisMax _______ XticLabelsCol#: __  _____X-axis label______________

  .fRy1axis    Y1Column: 2__    Y1axisMin ______ Y1axisMax _______ LineType(1-29): __  _____Y1-axis label_____________

  .fRy2axis    Y2Column: ___    Y2axisMin ______ Y2axisMax _______ LineType(1-29): __  _____Y2-axis label_____________

  .fRoutopts   Image file type: O GIF   O PNG  O JPG  O PS  O SVG  {TestImg}   PlotType: O Line  O Point  O Both

  .fRpixels    Xpixels: 800__   Ypixels: 600__   LineWidth(1-6): 1

  .fRmsg        [ ..........  Messages go here  ......................................................]


From the GUI 'sketch' above, it is seen that the GUI consists of about

  • 7 button widgets
  • 19 label widgets
  • 20 entry widgets (3 more could be added to specify tic-mark interval)
  • 8 radiobutton widgets in 2 groups
  • 1 checkbutton widget
  • 0 scale widgets
  • 0 listbox widgets
  • 0 text widgets
  • 0 canvas widgets

Another checkbutton or entry widget could be used to implement the option of rotated x-axis tic labels.

Here is an image of the GUI that I ended up with for a 'first release'.

As I use this utility, I may find that I want to alter the GUI somewhat. If I make some significant changes, I intend to replace the script file here with the new file.

This GUI is not meant to be a toy or simply a demo.

The plot of world population data shown at the top of this page indicates that this Tk GUI is meant to be an actual 'productivity' tool --- a free and open-source one --- a tool that is open to enhancement and 'tweaking'.


DESCRIPTION OF THE CODE

Below is a link to the code that produced this GUI.

I follow my usual 'canonical' structure for Tk code, for this Tk script:


  0) Set general window & widget parms (win-name, win-position,
     win-color-scheme, fonts, widget-geometry-parms, win-size-control).

  1a) Define ALL frames and sub-frames.
  1b) Pack   ALL frames and sub-frames.

  2) Define & pack all widgets in the frames.

  3) Define keyboard or mouse/touchpad/touch-sensitive-screen
     action BINDINGS, if needed.

  4) Define PROCS, if needed.

  5) Additional GUI initialization (typically with one or more of
     the procs), if needed.


This Tk coding structure is discussed in more detail on the page A Canonical Structure for Tk Code --- and variations.

This makes it easy for me to find code sections --- while generating and testing Tk scripts, and when looking for code snippets to include in other Tk scripts (code re-use).


Experimenting with the GUI

As in all my scripts that use the 'pack' geometry manager (which is all of my 100-plus Tk scripts, so far), I provide the four main 'pack' parameters --- '-side', '-anchor', '-fill', and '-expand' --- on all the 'pack' commands for the frames and widgets.

I think I have found a good setting of the '-side', '-anchor', '-fill', and '-expand' parameters on the 'pack' commands for the various widgets of this GUI.

In particular ...

The filename, plot-title, axis-titles entry widgets expand/contract appropriately when the window size is changed --- and button and label widgets stay fixed in size and relative-location as the window size is changed.

Entry fields for column-numbers, axis-limits, line-width/types, and pixel-sizes stay fixed in size.

If anyone wants to change the way the GUI configures itself as the main window size is changed, they can experiment with the '-side', '-anchor', '-fill', and '-expand' parameters on the 'pack' commands for the various widgets --- to get the widget behavior that they want.

---

Additional experimentation:

You could change the fonts used for the various GUI widgets.

For example, you could change '-weight' from 'bold' to 'normal' --- or '-slant' from 'roman' to 'italic'. Or change font families.

In fact, you may NEED to change the font families, because the families I used may not be available on your computer --- and the default font that the 'wish' interpreter chooses may not be very pleasing.

Furthermore, there are variables used to set geometry parameters of widgets --- parameters such as border-widths and padding.

Feel free to experiment with those parameters as well.

---

Note that the 3 'Color' buttons call on an RGB color-selector-GUI script to set the colors.

You can make that color-selector script by cutting-and-pasting the code from the page offering 'a non-obfuscated color selector GUI', on this site.


Some features of the code

There are plenty of comments in the code to describe what most of the code-sections are doing.

See the 'PROCS' section of the code to see the code in all the procs that are used in this Tk script.

The main plotting code is in the proc 'replot'.

See the comments in that proc for details on how the plotting is implemented by creating a 'gnuplot' script of commands to pass to the 'gnuplot' program.

Here is a list of the procs in this Tk script:

  • get_filename
  • view_file
  • replot
  • display_test_img
  • edit_inputs
  • getset_color
  • update_color_button
  • popup_msgVarWithScroll

Although it sounds like stating the obvious, it is probably worth mentioning that the 'get_filename' proc is called by the 'GetFilename' button, and the 'replot' proc is called by the 'RePlot' button --- and the 'getset_color' proc is called by the 'Color' buttons.

The 'update_color_button' proc is called (once for each color button) near the bottom of the Tk script to initialize the GUI, after initializing some color variables.

And the 'update_color_button' proc is also called in the 'getset_color' proc.

Just a few more comments on some 'features' of this script:

  1. ViewFile:

    After using this utility on a few test files, I found that it would be handy to open the data file in a text file browser --- for example, in order to see the comments that I put at the top of a file, to help in setting titles --- or to see the data columns, to set min,max values for over-riding the default 'autoscale' functionality of 'gnuplot' (i.e. replace the asterisks in the min,max entries with numeric values).

    So I added a 'ViewFile' button to the GUI --- and the 'view_file' proc is called by that button.

    A 'TXTFILEviewer' variable can be used to set the text-file-viewer program to use.

    I have it set to use the FE 'xpg' utility.

    By the way, 'gnuplot' recognizes '#' as a comment line indicator in a data file. And 'gnuplot' allows you to change that indicator.

  2. EditInput:

    The 'edit_input' proc is called by the 'replot' proc to check the entries on the GUI --- that they are the proper numeric type, in the proper range, etc.

    If there is an exception, the 'popup_msgVarWithScroll' proc is used to popup a message to the user.

    The 'popup_msgVarWithScroll' proc is also called by the 'Help' button to show the text in the 'HELPtext' variable, which is set at the bottom of the script.

  3. Output Display:

    'gnuplot' typically renders the plot into an output file in a fraction of a second.

    Some 'viewer' variables are used in this Tk script to set the viewer program to use for the various output types.

    I have set variables as follows:

    • set GIFviewer "/usr/bin/eog"
    • set PNGviewer "/usr/bin/eog"
    • set JPGviewer "/usr/bin/eog"
    • set PSviewer "/usr/bin/evince"
    • set SVGviewer "/usr/bin/inkscape"

    where 'eog' is the 'Eye of Gnome' image file viewer utility. 'evince' is a PDF and Postscript file viewer.

    Inkscape is an SVG editor. Inkscape is slow to open. It might be just as fast to use a web browser, like Firefox, as the SVG viewer.


Comments in the Code

It is my hope that the copious comments in the code will help Tcl-Tk coding 'newbies' get started in making GUI's like this.

Without the comments, potential young Tcler's might be easily frustrated and be tempted to return to their iPhones and iPads and iPods --- to watch what 'Cait' and the 'dashians are doing now.


The Tcl-Tk script CODE

Here is a link to CODE for the script 'tkGnuplotXY_file2or3cols.tk'.

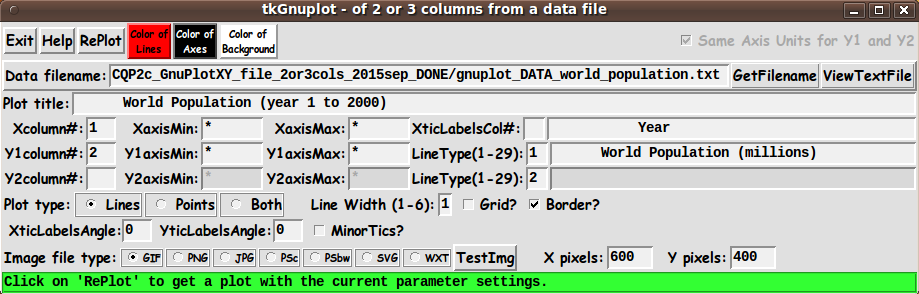
And here is a link to a SAMPLE DATA file 'gnuplot_DATA_world_population.txt'.

I have most of the entry field variables set, in an 'Additional GUI Initialization' section near the bottom of the Tk script, to accomodate this test file when you first try this Tk GUI.


Other 'gnuplot' utilities

This is the first of several 'gnuplot front-end' utilities that I plan to write.

Other Tk 'gnuplot front-end' scripts that may follow are:

  1. bar chart, created from data in a file

  2. math expression xy-plot, created from an expression entered on the GUI

  3. math expression 3D-surface-plot, created from an expression entered on the GUI

  4. points and/or lines xy-plot, created from data entered on the GUI

  5. a many-column xy-plot, created by selecting many columns of data, say, up to 10, from a text file containing columns of data --- with text-strings in the file containing names that can be used for a plot 'key' (legend) for the many lines on the plot.


Future Enhancements:

I have not tested this script extensively.

No doubt, if I use it some more, I will find a few things to change, add, or fix.

I pointed out, above, that I may someday implement the 'Same Scale for Y1,Y2' checkbutton.

In that case, if a user unchecks the button, several entry fields on the GUI would be changed from 'disabled' mode to 'enabled' mode.

For example, the Y2 min,max entry fields and the Y2 axis label entry field.

I pointed out, above, that I plan to provide an option on the GUI, someday, to rotate the X-tic-labels by 90 degrees or some other angle like -45 degrees.


In addition, I may someday add a couple more 'terminal types' for output.

The 'PS' option currently implements 'terminal postscript landscape color colortext'.

I may add a 'PSbw' option to implement 'terminal postscript landscape mono blacktext'.

Furthermore, I may implement a 'WXT' terminal type.

The 'wxt' terminal uses the wxWidgets library, which is where the 'wx' comes from.

The actual drawing is done via Cairo, a 2D graphics library, and Pango, a library for laying out and rendering text.

The 'wxt' terminal may offer the ability to get some high-quality output, because it may offer better quality lines and text (perhaps due to better anti-aliasing).

However, the 'wxt' terminal does not write to an image file.

The output is put in a terminal window.

To get an image file, the user can use a screen-capture utility (such as 'gnome-screenshot' on Linux) to get the image in a PNG file.

Then an image editor (such as 'mtpaint' on Linux) can be used to crop and resize the image file, if necessary.

And a command like 'pngcrush -brute' can be used to minimize the size of the final PNG file.


As I point out at the bottom of the 'HELPtext' for this Tk script, someday I may try to get more appealing plots --- with color gradient backgrounds and with 'shadow curves' and with 'ribbon curves' --- by using some of the 'gnuplot tricks' of Zoltan Voros, that can be seen at 'www.phyast.pitt.edu/~zov1/' in

If those pages are no longer available, you can see a couple of examples of that high-quality 'gnuplot' output at the bottom of a page on a Tk GUI Front-End for 'gnuplot' - for generating MATH EXPRESSION xy-plots - allowing for up to 3 math expressions on a plot.

I wrote that tkGUI 'front-end' for 'gnuplot' after I wrote this tkGUI front-end.

In fact, on that web page, in an image of the 'math-expression' GUI, you can see that I implemented the 'PSbw' and 'WXT' gnuplot terminal types, so it will be a simple matter of incorporating that code into this Tk script.

On that GUI, I also provided an option to rotate both the X-tic-labels and the Y-tic-labels by any number of degrees, with both defaulted to 0.

So it will be a relatively easy project to add the same entry fields and proc code to this Tk script.


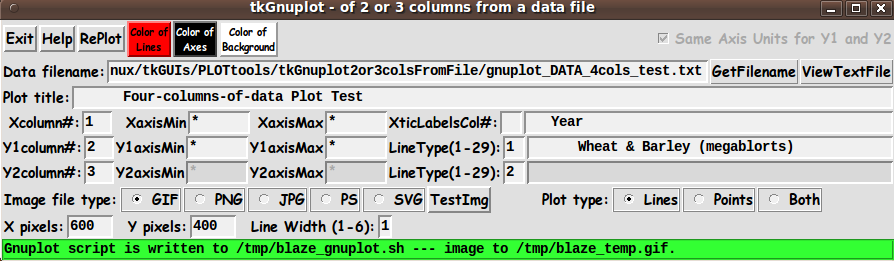
I probably should have put the 'PlotType' radiobuttons and the 'LineWidth' prompt in the same line (Tk 'frame') --- and put the x-and-y-pixels prompts in the same frame with the 'ImageType' radiobuttons.

I may do that someday. It is basically a matter of changing a few 'pack' statements, after changing some frame names in some widget-defining statements.


Thanks (again)

On many of my 'tkGooie' code donation pages, I have said ...

There's a lot to like about a utility that is 'free freedom' --- that is, no-cost and open-source so that you can modify/enhance/fix it without having to wait for someone else to do it for you (which may be never).

A BIG THANK YOU to Ousterhout for starting Tcl-Tk, and a BIG THANK YOU to the Tcl-Tk developers and maintainers who have kept the simply MAH-velous 'wish' interpreter going.


This is a large-size image of the
image at the top of this page.
This is the 'eog' (Eye of Gnome) image viewer utility
showing the world-population plot, in a GIF file.

UPDATE - 2015oct13:

I have replaced the code at the link above with code that implements several of the 'future enhancements' mentioned above.

Main changes are:

  • Changed the plot-types and output-options frames to group some widgets differently.

  • Added 'PSbw' & 'WXT' radiobuttons to provide those 'terminal types'.

  • Added 'Tic Labels Angle' entry widgets, for the x and y axes.

  • Made some changes to get some entry fields to line up precisely, along vertical lines.

  • Added 3 checkbuttons for Grid, Border, and MinorTics on/off options.

  • This does not show on the GUI, but, internally, I consolidated

    • 3 'getset_*_color' procs to one 'getset_color' proc, and

    • 3 'update_*_color_button' procs to one 'update_color_button' proc.

    I also removed some unused procs.

Someday I may add a 'Clear' button to allow for easily clearing the filename entry field of a long filename.

And I may add an 'Autoscale' button, to quickly reset the min,max entry fields to asterisks.


You can see an image of the new GUI when it first comes up, just below.

Note that although the GUI looks quite 'busy', when it first comes up, the user can simply click the 'RePlot' button to immediately get a plot, using the initial GUI settings.

Then the user can start changing parameters to get at a desired plot.

I know that many operating systems are going for an 'ultra-clean' look --- hiding most options.

That is frustrating to me. For one thing, it is typically not clear where to look to find ANY of the operating options, even a Help option.

I prefer having as many options 'exposed' as possible --- especially the frequently-used options.

I do not like clicking through drop-down menus trying to find options.

Having the options exposed to immediate usage means many fewer clicks during a work session.


By the way, here is the gnuplot script file that was created in one of my test runs.


    #!/usr/bin/gnuplot ! cd /tmp set terminal wxt persist title "WXT terminal window" set title ' World Population (year 1 to 2000)' set timestamp '%Y %b %d %a %H:%M:%S' set xlabel ' Year' set ylabel ' World Population (millions)' set xrange [ * : * ] set yrange [ * : * ] set xtics rotate by 0 set ytics rotate by 45 set mxtics set mytics set xzeroaxis set yzeroaxis set grid xtics ytics lt 0 lw 1 set border 15 set nokey plot '...a filename goes here ...' using 1:2 with linespoints linewidth 1 linecolor rgb '#FF0000' linetype 1

This is pretty crisp and clean, compared to all the comments that I have around the Tcl-Tk code that is writing out these gnuplot commands.

Note that by using the Tk GUI, the user can typically avoid having to page back and forth through 'gnuplot' documentation trying to find commands to use and the proper syntax for those commands --- and parameters to use with those commands.

And the user avoids many syntax errors, because I filtered out the errors that I made during testing, resulting in gnuplot commands that are probably going to work --- with gnuplot 4.2 and thereafter.

Essentially all of a user's documentation searching and syntax debugging is eliminated by use of this Tk GUI.

Bottom of this web page for
presenting Tcl-Tk code for
tkGnuplotXY_2or3colsFromFile
--- a 'gnuplot'-front-end plot utility
in the FE 'tkGooies' system,
in the 'PLOTtools' group.

To return to a previously visited web page location, click on the Back button of your web browser a sufficient number of times. OR, use the History-list option of your web browser.
OR ...

< Go to Top of Page, above. >

Page history:

This FE web page was created 2015 Oct 07.

Page was changed 2015 Oct 13.
(New, updated code.)

Page was changed 2019 Mar 05.
(Added css and javascript to try to handle text-size for smartphones, esp. in portrait orientation.)

Page was changed 2019 Jun 15.
(Specified image widths in percents to size the images according to width of the browser window.)


NOTE:
This code and description has not been posted on a Tcler's Wiki page --- at wiki.tcl-lang.org --- formerly wiki.tcl.tk. If I ever do so, I plan to add a link to that page here --- as a backup and alternative to this page.