FE 'tkGooie' Utilities
'MATHed' subgroup of
the 'MATHtools' group

A Tk GUI script
demonstrating
Ptolemy's Theorem

--- an equation
relating the
lengths of the
2 diagonals and
the lengths of the
4 sides of any
quadrangle
inscribed in
a circle.
(FE = Freedom Environment)

GUI which allows the
user to move the
vertices BCD of a
quadrilateral
inscribed in a circle
---
and watch that
the product of the
lengths of the diagonals
ALWAYS equals the sum of
the products of the lengths
of the opposite sides.

FE Home Page > FE Downloads Page >

FE 'tkGooies' Description Page >

FE 'tkGooies' 'MATHtools' Menu >

FE 'tkGooies' 'MATHed' Menu >

This
'tkPtolemysTheorem_QuadrangleInCircle'
Tk-GUI code Page

INTRODUCTION to Tcl-Tk script
'tkPtolemysTheorem_QuadrangleInCircle'

In the 2013-2016 time frame, I started making some 'tkGooie' scripts for a 'MATHed' (Mathematics Education) toolchest --- scripts such as:

In my readings of various books popularizing math and, in particular, books containing discoveries in plane (Euclidean) geometry, such as the book

I ran across static images representing the ancient Ptolemy's theorem that says:

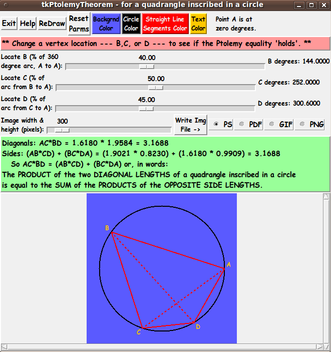
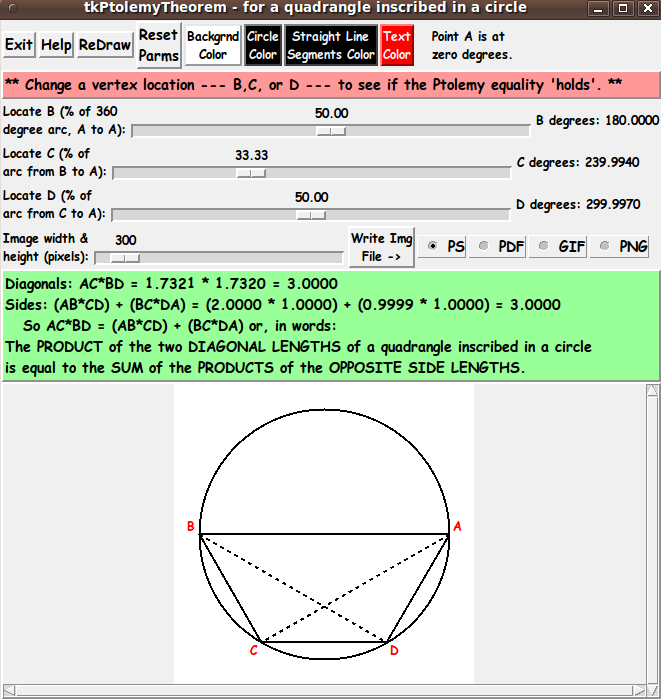
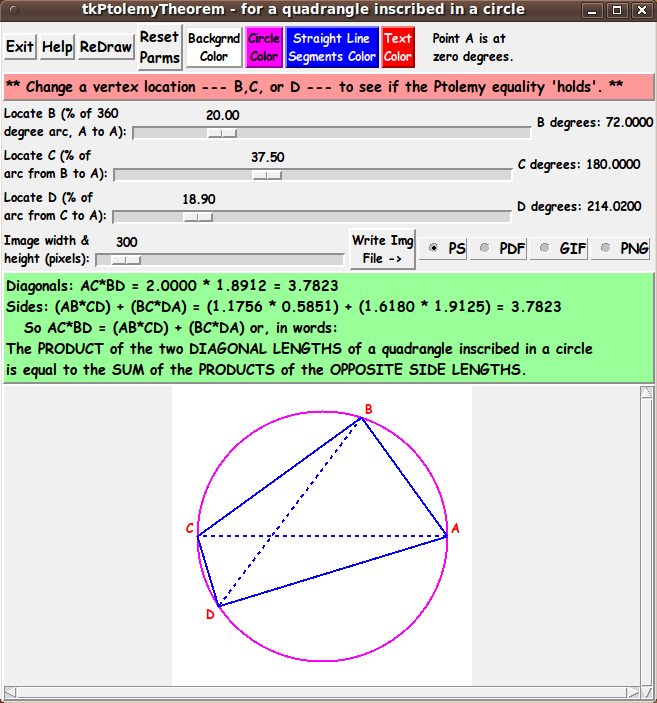
    Given a quadrangle (alias quadrilateral) inscribed in a circle, the product of the lengths of the two diagonals is equal to the sum of the two products of the lengths of the opposite sides.

There is a nice write-up of a proof of Ptolemy's theorem in the last half of Chapter 6 of the book 'Trigonometric Delights' by Eli Maor.

Maor points out that several other truths of plane geometry and plane trigonometry are quick deductions from Ptolemy's theorem --- including the Pythagorean Theorem and the sine sum and difference formulas.

Although that book may not be readily available, you can immediately see some pictures and discussion at the Ptolemy's Theorem page at wikipedia.org.

How Ptolemy Used The Equation:

The book 'Great Calculations' by Colin Pask points out that Ptolemy used this relationship to make a table of chord lengths for angles between 0 and 180 degrees.

Ptolemy used the relationship (the equality) to

  1. get the chord length subtending half an angle, given the chord length subtending the original angle

    AND

  2. get the chord length subtending the difference of 2 angles, given the chord lengths subtending the 2 angles.

Those two capabilities allowed Ptolemy to make a table of chord lengths of at least 180 equally-spaced angles between 0 and 180 degrees.

Tables of chord lengths were the precursors of sine tables.

    (In a unit circle, the length of a chord of an angle is twice the sine of half the angle.)


There are many web sites with more information on Ptolemy's theorem.

So if you want to see a variety of discussions of this theorem, you can do a WEB SEARCH on keywords like

If you can deal with the annoying popups and advertisements, one web site that is rife with math results is the 'Cut The Knot' site --- which has a page on Ptolemy's Theorem --- including reference to a proof done with complex numbers.

In any case, with the Tk script (whose code is presented on this page), I was seeking to make the demonstration of the validity of Ptolemy's Theorem an interactive and dynamic (semi-animated) experience --- using Tcl-Tk.

    Around 2016, with the advent of Javascript enhancements associated with HTML 3.0, some dynamic, interactive demos of math results started appearing on the internet, such as the 'Wolfram Demonstrations Project'.

    There is an animated demonstration of Ptolemy's Theorem at demonstrations.wolfram.com.

    In addition, the Wolfram 'MathWorld' site has a 'static image' page on Ptolemy's Theorem.

One feature of the 'tkGooie' presented on this page is that it comes bundled within a 'tkGooies' menu-driven system that can be installed on a computer --- or on a file server that serves files to multiple computers.

    Another feature of the 'tkGooies' is that I generally provide more control of colors than one sees in many math demo utilities.


Basic Goals of the Tk Script:

My purpose for this Tk GUI script is/was to generate a circle with a quadrangle (alias quadrilateral) inscribed in the circle.

The user is to be able to easily change the position of the vertex points of the quadrangle, around the circumference of the circle.

    'Without loss of generality', we can fix one of the four points and allow the user to move the other three.

To allow for pretty precise control in drawing these points, I decided to use 3 Tk 'scale' widgets to adjust the position of 3 of the points --- B, C, D --- counter-clockwise around the circle --- keeping point A fixed.

The drawings are to be done in a resizable square image area --- in a Tk 'canvas' widget.

The GUI is to automatically delete-and-redraw (for the user) any changed points --- which means that this utility is to delete-and-redraw the two diagonals as well as the 4 sides of the quadrangle --- while also showing that Ptolemy's equation holds no matter the position of B, C, and D.


PLANNED LAYOUT OF THE GUI:

As I have done with other Tk scripts that I have written in the past year or so, I laid out a 'text image' of the GUI --- to aid me as I coded the frames and widgets.

I used the following conventions to make the sketch, with a text editor.


  SQUARE-BRACKETS indicate a comment (not to be placed on the GUI).
  BRACES          indicate a Tk 'button' widget.
  A COLON         indicates that the text before the colon is on a 'label' widget.
  <---O--->       indicates a Tk 'scale' widget (if any).
  CAPITAL-X       indicates a Tk 'checkbutton' widget (if any).
  CAPITAL-O       indicates a Tk 'radiobutton' widget (if any).
  UNDERSCORES     indicate a Tk 'entry' widget (if any).


  According to those conventions,
  I created the following 'text sketch'.


 FrameNames
 VVVVVVVVVV
              -----------------------------------------------------------------------------
              tkPtolemysTheorem --- for a quadrangle inscribed in a circle
              [window title]
              -----------------------------------------------------------------------------

 .fRbuttons   {Exit} {Help} {ReDraw} {Reset  {Backgd  {Circle  {Straight Line   {Text
                                      Parms}  Color}   Color}   Segments Color}  Color}
 
 .fRmsg       [ .......... Message line --- for advice to the user .................. ]

                                           0.0            100.0  
 .fRpointB    Locate B (% of arc A to A):  <--------O--------->   B degrees: [number here]

                                           0.0            100.0  
 .fRpointC    Locate C (% of arc B to A):  <--------O--------->   C degrees: [number here]

                                           0.0            100.0  
 .fRpointD    Locate D (% of arc C to A):  <--------O--------->   D degrees: [number here]

              Image width and   50                4000  {WriteImg
 .fRimgsize   height (pixels):  <----------O--------->   File ->}    O PS  O PDF  O GIF  O PNG
 
 .fRresult    [ .. Calculated Left-Hand and Right-Hand sides of the equation are shown here .. ]

 .fRcanvas    -----------------------------------------------------------------------------
              |                                                                           A
              |                                                                           |
              |                                                                           |
              |  'Canvas' for displaying the circle and inscribed quadrangle              |
              |   in a square image area.  (with scrollbars)                              |
              |                                                                           |
              |                                                                           |
              |                                                                           |
              |                                                                           V
              <--------------------------------------------------------------------------->


Perhaps some aspects of the sketch could use a little more explanation:


  A combination of VERTICAL-BAR CHARACTERS AND HYPHEN (or UNDERSCORE) CHARACTERS,
  that outline a RECTANGULAR SHAPE, are used to indicate either a Tk 'canvas' or
  a Tk 'listbox' widget or a Tk 'text' widget.

  A LINE (HYPHENS or VERTICAL-BARS) WITH AN 'ARROW-HEAD' AT EACH END indicates
  a Tk 'scale' widget --- or a 'scrollbar' widget.

  SCROLL-BAR 'ARROW-HEADS' (for a 'canvas', 'listbox', or 'text' Tk widget)
  are drawn as follows:

   UP    ARROW-HEAD   is drawn with a CAPITAL-A.
   DOWN  ARROW-HEAD   is drawn with a CAPITAL-V.
   LEFT  ARROW-HEAD   is drawn with a LESS-THAN sign.
   RIGHT ARROW-HEAD   is drawn with a GREATER-THAN sign.

  UP-and-DOWN    ARROW-HEADS  at the right/left of a box shape indicate
  a VERTICAL SCROLL-BAR there.

  LEFT-and-RIGHT ARROW-HEADS  at the bottom/top of a box shape indicate
  a HORIZONTAL SCROLL-BAR there.

  The arrow-heads on a horizontal scrollbar are joined by hyphens, rather than
  underscores.


From the diagram above, I could see that this GUI will contain about:

  • 9 'button' widgets
  • 6 'label' widgets
  • 4 'scale' widgets
  • 1 'canvas' widget (with x-y scrollbars)
  • 4 'radiobutton' widgets (in one group)
  • 0 'checkbutton' widgets
  • 0 'entry' widgets
  • 0 'listbox' widgets
  • 0 'text' widgets

Assembling the pieces
(The GUI)

Now it was a matter of putting the pieces together.

I took 'code-pieces' from some of my other Tk scripts that 'draw' in an image area on a Tk canvas and use a 'scale' widget --- such as from my

Thales' Theorem script.

I ended up with the following GUI as an initial display.

Note that I have provided 3 color buttons on the GUI so that the user can control :

  • the background color of the image area

  • the color of the lines drawn
    (the circle and the 4 quadrangle sides and the 2 diagonals)

  • the color of text-characters that are placed on the 'canvas'.

The message area just below the top line of 'button' widgets is used to advise the user on the next operation to perform.

A second message area just below the 'scale' widgets shows the user the current values of the 2 diagonal-lengths and 4 side-lengths of the quadrangle --- which are used to evaluate the left and right hand sides of Ptolemy's equation --- repeatedly confirming the equality.

'Without loss of generality', we draw point A on the right side of the circle --- because for any circle with an inscribed quadrangle, we could always rotate the circle so that the point A is on the extreme right side of the circle.

'Without loss of generality', we draw a 'unit circle' --- a circle with radius one unit --- whatever that unit is.

We can do this because, for any given circle, we can take its radius as our unit of measure --- so the circle will always have radius equal to one.

By default, the GUI starts with an initial inscribed quadrangle --- and with the 2 diagonals shown as dotted lines.

In the lower message area are shown the lengths and calculations that confirm the equality of the left and right hand sides of Ptolemy's equation.

NOTE:
We are NOT using the GUI to show a proof of the theorem.

We use the GUI to VERIFY that Ptlolemy's equation 'holds' --- no matter how we position the sequence of points B,C,D --- counter-clockwise --- around the circumference of the circle.

---

Below is an image that was drawn such that one of the sides of the quadrilateral is a diameter of the circle (by placing point B halfway around the circle) --- and positioning points C and D to form a trapezoid.

Before clicking the 'Redraw' button, the background color was changed from blue to white --- and the color of the straight-line-segments was changed from red to black --- and the text color was changed from orange to red.

    We could have also changed the image size from 300 pixels to some other size, for the square 'canvas'.

This trapezoidal configuration --- with one side being a diameter of the circle --- is used to derive a corollary of Ptolemy's theorem. (See Maor's 'Trigonometric Delights'.)

---

Below is an image that was drawn such that one of the diagonals of the quadrilateral is a diameter of the circle (by placing point C halfway around the circle).

The circle-color and line-segments-color were changed, from the previous image, for this image.

This configuration --- with one diagonal being a diameter of the circle --- is used to derive another corollary of Ptolemy's theorem. (See Maor's 'Trigonometric Delights'.)

---

The 'WriteImgFile' button (to the right of the pixels 'scale' widget) could be used to write out

  • a color Postscript file,
  • a color PDF file,
  • a color GIF file, or
  • a color PNG file,

depending on the setting of the 4 'radiobutton' widgets to the right of the 'WriteImgFile' button.

Note that when printing out the image, it will typically be advisable to change the background color of the canvas to white --- to avoid using a lot of ink unnecessarily.

---

Execution time:

After clicking on the 'ReDraw' button, the computations and drawing --- and the display of the values of the left and right hand sides of Ptolemy's equation --- complete almost immediately.

Wouldn't Thales and Euclid and Archimedes and Galileo and Newton and Euler and the Bernoulli's and Gauss and Cauchy and Weierstrass and Poincare and Riemann and many many other mathematicians and astronomers and physicists have loved to be able to use Tcl-Tk?

I wonder what wonders they would have performed with the 'wish' interpreter at their disposal?

Sure beats drawing in the sand or drawing with quill and ink-well --- and beats calculating 'by hand' (excruciatingly slowly).

---

Implementing the Color Buttons

The 3 color buttons call on an 'external' color-selector-GUI script to set those colors.

You can make that color-selector script by cutting-and-pasting the code from the page that offers

a non-obfuscated color selector GUI

on this site.

You can see the code at the bottom of this 'tkPtolemysTheorem' script to see how the name and location of the color selector script is set.

The color-selector script can be put in the same directory with this 'tkPtolemysTheorem' script.


DESCRIPTION OF THE CODE

Below, I provide the Tk script code for this 'tkPtolemysTheorem' 'app'.

I follow my usual 'canonical' structure for Tk code, for this Tk script:


  0) Set general window & widget parms (win-name, win-position,
     win-color-scheme, fonts, widget-geometry-parms, win-size-control).

  1a) Define ALL frames (and sub-frames, if any).
  1b) Pack   ALL frames and sub-frames.

  2) Define & pack all widgets in the frames, frame by frame.
              Within each frame, define ALL the widgets.
              Then pack the widgets.

  3) Define keyboard and mouse/touchpad/touch-sensitive-screen action
     BINDINGS, if needed.

  4) Define PROCS, if needed.

  5) Additional GUI initialization (typically with one or more of
     the procs), if needed.


This Tk coding structure is discussed in more detail on the page A Canonical Structure for Tk Code --- and variations.

This Tk coding structure makes it easy for me to find code sections --- while generating and testing this script, and when looking for code snippets to include in other scripts (code re-use).


Experimenting with the GUI

As in all my scripts that use the 'pack' geometry manager (which is all of my 100-plus Tk scripts, so far), I provide the four main 'pack' parameters:

  • '-side'
  • '-anchor'
  • '-fill'
  • '-expand'

on all the 'pack' commands for the frames and widgets.

I think I have found a good setting of the '-side', '-anchor', '-fill', and '-expand' parameters on the 'pack' commands for the various widgets of this GUI.

In particular ...

The 'frame' widget containing the square 'canvas' widget will expand/contract appropriately for a requested image size --- and button, label, and scale widgets stay fixed in size and relative-location when the user re-sizes the window.

    If anyone wants to change the way the GUI configures itself as the main window size is changed, they can experiment with the '-side', '-anchor', '-fill', and '-expand' parameters on the 'pack' commands for the various widgets --- to get the widget behavior that they want.

---

Additional experimentation with the GUI
---its appearance:

You could change the fonts used for the various GUI widgets.

For example, you could change '-weight' from 'bold' to 'normal' --- or '-slant' from 'roman' to 'italic'.

Or change font families.

    In fact, you may NEED to change the font families, because the families I used may not be available on your computer --- and the default font that the 'wish' interpreter chooses may not be very pleasing.

Furthermore, there are variables used to set geometry parameters of widgets --- parameters such as border-widths and padding.

And the '-relief' values for frames and widgets could be changed.

Feel free to experiment with those 'appearance' parameters as well.


Some features of the code

There are plenty of comments in the code to describe what most of the code-sections are doing.

See the top of the 'PROCS' section of the script for a list of the procs used in this Tk script.

See comments in the procs for details on the purpose of each proc and for details on the methods by which each proc was implemented.

Here is a quick overview of the procs --- to give an idea of the 'guts' of this utility:


    'redraw'                - Called by the 'Redraw' button and
                              in the 'Additional GUI Initialization' section
                              at the bottom of this script to put an initial drawing
                              on the canvas.

    'draw_circle'           - Called by the 'redraw' proc.

    'draw_quadrangle'       - Called by the 'redraw' proc.

 'setMappingVars_for_px2wc' - Called by the 'redraw' proc.

        'Xwc2px'            - Called in the 'draw' procs.

        'Ywc2px'            - Called in the 'draw' procs.

  'reset_parms'             - Called by the 'ResetParms' button.

  'set_background_color'    - Called by the 'BackgroundColor' button.
 
  'set_circle_color'        - Called by the 'CircleColor' button.
 
  'set_line_color'          - Called by the 'LineColor' button.

  'set_text_color'          - Called by the 'TextColor' button.

  'update_button_colors'    - Called by the 'set_*_color' procs. 

  'advise_user'             - Used by various procs and bindings to put a message
                              for the user on a message line of the GUI. 

  'show_Bdegrees'           - Called by a command option of the B scale widget.
  'show_Cdegrees'           - Called by a command option of the C scale widget.
  'show_Ddegrees'           - Called by a command option of the D scale widget.   

  'popup_msgVarWithScroll'  - called by 'Help' button to show HELPtext var.


The initial drawing on the canvas is performed by the 'redraw' proc.

See the comments in that proc to see how it is implemented.


A fervent hope

It is my hope that the copious comments in the code might help Tcl-Tk coding 'newbies' get started in making GUI's like this.

Without the comments --- especially in the 'redraw' and 'setMappingVars_for_px2wc' and 'Xwc2px' and 'Ywc2px' procs --- the code might look even more cryptic than it already is.

Without the comments, potential young Tcler's might be tempted to return to their iPhones and iPads and iPods --- to look for videos of TV news organizations interviewing politicians and their 'surrogates' (and NOT asking obvious follow-up questions).

Examples of not-asked questions:

  • Why does the head of the U.S. national 'Fraternal Order of Police' never admit that there are some police who should not be police?

    ... that there are some police with anger-management issues?

    ... that there are some police who repeatedly show bad judgement?

    Does he not realize that, in continuing to coddle these bad police, the good (desirable) police are bound to suffer 'unintended consequences'?

    ... not to mention citizens suffering the consequences of bad police being retained on police forces.

    Does he not realize that he is putting the lives of innocent police in harm's way by not weeding out the police that generate dangerous responses from those citizens who are endangered by bigoted or prone-to-excessive-violence police?

  • Why don't politicians --- Democrat as well as Republican --- ever propose an annual (or every two years) cost-of-living increase for the federal minimum wage?

    They don't even propose it ... much less pass it.

    Wouldn't this be a much better (and gradual) way to adjust the minimum wage --- than to wait for ten years or more to pass an increase --- which then is going to be adamantly opposed by small-businessmen (mom-and-pop retailers, electricians, plumbers, carpenters, landscapers, farmers, etc. etc.) as being 'too wrenching a change'?

    For fairness, why not tie increases to the federal minimum wage to salary increases that Congress-people vote for themselves?

    ... with 'catch-up' percentage increases that recognize that Congress has base-pay about ten times larger than people on minimum wage?

    Henry Ford realized that workers with decent pay help boost the economy (or at least can afford to buy his automobiles).

    Henry Ford realized that 'a rising tide lifts ALL the boats' --- in particular, HIS boat.

    Why does Congress not recognize this --- especially Republican Congressmen?

    (Henry Ford was, no doubt, a 'conservative' Republican. This Republican recognized this economic 'tidal' fact.)

    Why do individual states have to pass minimum-wage increases as they recognize that the national Congress is letting things get 'way out of whack'?

    Isn't this a sign that the national Congress is not doing a proper and appropriate job --- their job?

  • I've got hundreds of examples of these never-asked questions that should be asked by 'nightly-news' interviewers? More later.

Potential Tclers:

When you get tired of looking at devoid-of-common-sense TV-interviews-with-politicians-and-the-like, try installing-using-changing-enhancing the following Tk GUI script.

To help out in making scripts like this, here is

a page that provides sources of Tcl-Tk code snippets

by providing links to various 'tkGooies' scripts that can make it relatively quick work to compose

  • widget definitions,
  • bind statements, and
  • procedure code.

And when you get to the testing-and-debugging phase in development of a Tk script, here is

a page that describes the wonderfulness
of the 'wish' 'stack trace' facility
,

which can make the testing-and-debugging go relatively quickly and painlessly.


The Tcl-Tk Script CODE

Here is a link to CODE for the Tk script

'tkPtolemysTheorem_ QuadrangleInCircle.tk'.

With your web browser, you can 'right-click' on this link --- and in the menu that pops up, select an option like

' Save Link Target As ... '

to save this file to your local computer.

Then you can rename the file to remove the '.txt' suffix.

Make sure that you have execute permission set on the file --- in order to execute the script.

Some possible FUTURE ENHANCEMENTS

There are quite a few enhancements that could be considered for this script, such as:

  1. Use a different method of changing the positions of the points B, C, D:

    Some people may find it more desirable to move the points B,C,D according to angle-degrees rather than via percent-of-remaining-arc.

    One way to do this is to allow the B,C,D scale widgets to range from 0 to 360 degrees --- instead of from 0 to 100 percent.

    And the movements of the 3 slider-bars could be restricted further:

    • B could be at any angle between 0 and 360 degrees,

    • C could be at any angle between B and 360 degrees,

    • D could be at any angle between C and 360 degrees.

  2. Put more observations directly on the canvas :

    For example, the lengths of 6 lines (4 sides and 2 diagonals) could be put on the canvas --- near the mid-points of those lines.

  3. More information in the 'Help' text display option:

    There are almost surely some improvements or additions that could be made to the text that I initially provide in the 'Help' option.

The bottom line here is that there are almost always non-trivial --- as well as trivial --- enhancements that could be made to --- or 'forks' that could be made from --- a Tk GUI 'app' like this.

One advantage of this Tk script is that it is 'open' code --- available to anyone for enhancement.

So if you would like to take a different approach to implementing this script, you are welcome to take this code and build on it (or reconstruct it).


IN CONCLUSION

As I have said on other code-donation pages on this site ...

There's a lot to like about a utility that is 'free freedom' --- that is, no-cost and open-source so that you can modify/enhance/fix it without having to wait for someone else to do it for you (which may be never).

A BIG THANK YOU to Ousterhout for starting Tcl-Tk, and a BIG THANK YOU to the Tcl-Tk developers and maintainers who have kept the simply MAH-velous 'wish' interpreter going.

Bottom of this web page for
presenting Tcl-Tk code for
'tkPtolemysTheorem_ QuadrangleInCircle'
--- a Tk-GUI-script 'app'
in the FE 'tkGooies' system,
in the 'MATHed' subgroup
of the 'MATHtools' group.

To return to a previously visited web page location, click on the Back button of your web browser a sufficient number of times. OR, use the History-list option of your web browser.
OR ...

< Go to Top of Page, above. >

Page history:

This FE web page was created 2017 Jan 09.

Page was changed 2019 Mar 05.
(Added css and javascript to try to handle text-size for smartphones, esp. in portrait orientation.)

Page was changed 2019 Jul 03.
(Specified image widths in percents to size the images according to width of the browser window. Also added some web links.)


NOTE:
This code and description has not been posted on a Tcler's Wiki page --- at wiki.tcl-lang.org --- formerly wiki.tcl.tk.

If I ever do so, as a backup and alternative to this page, I plan to add a link to that Wiki page here.