FE 'tkGooie' Utilities
'MATHed' group
Primes Sieve
(pixels in a
Resizable Image)
(FE = Freedom Environment)
The GUI interface of the
'tkGooie' to show the primes
as pixels on a Tk 'canvas'.
Large, hi-res images are below.
FE 'tkGooie' Utilities'MATHed' groupPrimes Sieve
(pixels in a
|
The GUI interface of the 'tkGooie' to show the primes as pixels on a Tk 'canvas'. Large, hi-res images are below. |
FE Home Page >
FE Downloads Page >
FE 'tkGooies' Description Page >
FE 'tkGooies' 'MATHtools' Menu >
FE 'tkGooies' 'MATHed' Menu >
This 'Primes Sieve' tkGooie MATHed Page
|
INTRODUCTION to Tcl-Tk script I recieved an education in mathematics and am retired now after a career involving computer science applications (and, eventually, Tcl-Tk programming) --- in manufacturing companies. In retirement, I am finally finding the time to read many books on mathematics. I find that there are many well-written books nowadays that combine an appreciation for the history of mathematics with discussions of 'fun' or interesting topics in math --- books by authors like I am planning on spending the next several years writing Tcl-Tk scripts that bring to life many of these classical and modern math topics by presenting geometry, numbers, etc. in an interactive and/or animated way on the Tk canvas. For my first contribution of this kind, on this wiki, I happen to have chosen to provide a display of prime numbers (via the 'sieve of Eratosthenes') on the Tk canvas. I have seen some Tcl-Tk 'primes' demo scripts that show a few hundred integers and then show the prime numbers among them by use of an 'Eratosthenes sieve' technique. But the demo scripts that I have seen show only a few hundred integers and show them as text. I decided that I would like to see the distribution of about a million to 10 million primes --- that is, I would like to see how the density of that many primes looks in an 'overview'. In order to see that many integers and primes at one time, I decided to show each prime and non-prime on a rectangular Tk 'canvas' widget as a single pixel for each integer. I wanted to use 2 different colors --- one for the primes and one for the non-primes --- with the user having the option to choose the two colors. I decided to show the integers (pixels) in the usual fashion --- in rows, with the integers increasing from left to right. And I wanted to make the canvas (or image) resizable so that the user can experiment with seeing how the pattern of primes changes as one uses a different number of pixels per row. To make it easy and quick to change the canvas (or image) width, I decided to make the canvas resizable by simply grabbing an edge or corner of the GUI window and dragging, with the mouse/pointer cursor.
NOTE: With those goals in mind, this utility ended up with features that can be summarized as follows. MAIN FEATURES of this script/utility : This Tk GUI script shows the primes and non-primes in the first M times N positive integers as colored pixels in a rectangular Tk Canvas --- where
The GUI (screenshot) In implementing these features, I ended up with the GUI seen in the following image. |
|
HELP TEXT The 'Help' button on the GUI shows text which includes the observations listed below the Tcl-Tk code that is provided below. DESCRIPTION OF THE CODE Below I provide a link to the Tk script code for this 'primes sieve on a Tk canvas image' utility. For this Tk script, I follow my usual 'canonical' structure for Tk code: |
  0) Set general window & widget parms (win-name, win-position,
     win-color-scheme, fonts, widget-geometry-parms, win-size-control,
     text-array-for-labels-etc).

  1a) Define ALL frames (and sub-frames, if any).
  1b) Pack   ALL frames and sub-frames.

  2) Define & pack all widgets in the frames, frame by frame.
     Within each frame, define ALL the widgets. Then pack the widgets.

  3) Define keyboard and mouse/touchpad/touch-sensitive-screen action
     BINDINGS, if needed.

  4) Define PROCS, if needed.

  5) Additional GUI initialization (typically with one or more of
     the procs), if needed.
|
This Tk coding structure is discussed in more detail on the page A Canonical Structure for Tk Code --- and variations. This structure makes it easy for me to find code sections --- while generating and testing a Tk script, and when looking for code snippets to include in other scripts (code re-use). I call your attention to step-zero. One new thing that I have started doing in 2013 is using a text-array variable --- named 'aRtext' --- for text in labels, buttons, and other widgets in the GUI. This can make it easier for people to internationalize my scripts. I will be using a text-array like this in most of my scripts in the future. Experimenting with the GUI As in all my scripts that use the 'pack' geometry manager (which is all of my 100-plus scripts, so far), I provide the four main pack parameters --- '-side', '-anchor', '-fill', '-expand' --- on all of the 'pack' commands for the frames and widgets. That helps me when I am initially testing the behavior of a GUI (the various widgets within it) as I resize the main window. I think that I have used a nice choice of the 'pack' parameters. In particular ... The labels and buttons and scales stay fixed in size and relative-location as the window is re-sized --- while the 'canvas' expands/contracts as the window is re-sized. You can experiment with the '-side', '-anchor', '-fill', and '-expand' parameters on the 'pack' commands for the various frames and widgets --- to get the widget behavior that you want. --- Additional experimentation with the GUI: You might want to change the fonts used for the various GUI widgets. For example, you could change '-weight' from 'bold' to 'normal' --- or '-slant' from 'roman' to 'italic'. Or change font families. In fact, you may NEED to change the font families, because the families I used may not be available on your computer --- and the default font that the 'wish' interpreter chooses may not be very pleasing. I use variables to set geometry parameters of widgets --- parameters such as border-widths and padding. And I have included the '-relief' parameter on the definitions of frames and widgets. Feel free to experiment with those 'appearance' parameters as well. --- Note that the color buttons call on a color-selector-GUI script to set the colors. You can make that color-selector script by cutting-and-pasting the code from the page offering 'a non-obfuscated color selector GUI' on this site. Some features in the code There are plenty of comments in the code, to describe what most of the code-sections are doing. You can look at the top of the PROCS section of the code to see a list of the procs used in this script, along with brief descriptions of how they are called and what they do. --- Here is a brief description of the two main procs of the script. |
   - 'load_primes_sieve_array' - loads an array with zeros and ones
                                 indicating whether the integer index of
                                 the array is a non-prime or a prime.

   - 'redraw_primes'     - clears the image structure (if any) and
                           creates a new image structure according to the
                           current width and height of the canvas widget ---
                           and then draws the on/off (colored) pixels in the
                           rectangular image structure on the canvas.
|
The 'load' proc is executed once, when the GUI starts up. The 'redraw' proc is executed when the GUI starts up and each time the canvas widget is resized. Comments in the Code It is my hope that the copious comments in the code will help Tcl-Tk coding 'newbies' get started in making GUI's like this. Without the comments, potential young Tcler's might be tempted to return to their iPhones and iPads and iPods --- to watch videos of people being hit by large vehicles such as buses and ice cream trucks. The Tcl-Tk CODE Here is a link to CODE for the script 'primesSieve_inResizableCanvas_ createImg.tk'.
NOTE: OBSERVATIONS on distribution of primes I must admit that I was rather surprised at first to see that the 'on' (prime) pixels were pretty evenly distributed over the entire rectangular canvas. I was expecting to see the primes thinning out in the lower rows of the rectangle. After some thought (and some web searches), I found that this is not so surprising after all. There are lots of primes, even when you look at integers out beyond a million or more. When you think about how the sieve works, in the first pass, it removes all the even integers (except 2). Thus about half the integers are eliminated at the beginning. (It may not be proper to talk about half of infinity, but it is an interesting concept. In any case, keep in mind that we are applying the sieve to a finite number of integers, albeit that we are using a larger-than-usual upper limit. So it is quite proper to say that we are eliminating essentially half the integers in the first step of the sieve operation.) Then when we eliminate the multiples of 3 (except 3 itself) in the second step, we are eliminating less than a third of the remaining integers --- because we have already eliminated multiples of 3 like 6 (=2*3) and 12 (=2*2*3) and 18 (=2*3*3) and 24 (=2*2*2*3) and on and on. And when we eliminate the multiples of 5 (except 5 itself) in the 3rd step, are eliminating less than a fifth of the remaining integers --- because we have already eliminated multiples of 5 like 10 (=2*5) and 15 (=3*5) and 20 (=2*2*5) and 30 (=2*3*5) and on and on. And so on with 7 and 11. In fact, when we get to 11, we are eliminating less than one-eleventh of the remaining integers. We have already eliminated a 'strong majority' of the integers by casting out the multiples of 2, 3, and 5. After the first five passes of the sieve (with 2, 3, 5, 7, 11), we have cast out about 80% or more of the integers as non-prime --- and we are casting out fewer and fewer with each succeeding step of the process.
So it really should not have been so surprising that the distribution
of the primes (shown as 'on' pixels in the rectangle of about a million
or more pixels) looks like a fairly even distribution of 'on' pixels
throughout the rectangle In fact, I found a page on the web (gone now) that showed the first 100,000 primes, between 1 and 1,299,709. You can try a WEB SEARCH on keywords such as 'prime numbers list'. Such listings show that, throughout the listing, you keep seeing prime integers that are only 2, 4, 6, or 8 units apart. Here is a sample section of the listing of the first 100,000 primes near line 57,500 : |
   57570, 713477, 10
   57571, 713491, 14
   57572, 713497, 6
   57573, 713501, 4
   57574, 713509, 8
   57575, 713533, 24
   57576, 713563, 30
   57577, 713569, 6
   57578, 713597, 28
   57579, 713599, 2
   57580, 713611, 12
   57581, 713627, 16
   57582, 713653, 26
   57583, 713663, 10
   57584, 713681, 18
   57585, 713737, 56
   57586, 713743, 6
   57587, 713747, 4
   57588, 713753, 6
   57589, 713771, 18
   57590, 713807, 36
   57591, 713827, 20
   57592, 713831, 4
   57593, 713833, 2
   57594, 713861, 28
   57595, 713863, 2
|
The numbers in the middle column are the prime numbers. On the left is the count of the number of the prime --- and the number on the right is the difference of the prime from the preceding prime. So we can expect to see primes only 2, 4, 6, or 8 units apart as we go into the millions and billions. In fact, if you look at a plot of the function pi(n) against n, where pi(n) is the number of primes less than n, it looks almost like a straight line --- but with a slight amount of curvature below and away from a straight line that is tangent to the start of the curve. So, indeed, the primes are thinning out --- but very slowly. You can see a plot of pi(n) for the 1st 1,000 positive integers at http://curvebank.calstatela.edu/ prime/ prime.htm. This primes page went dead between 2015 and 2018. A (temporary?) subsitute page that shows some plots of pi(n) is at http://old.nationalcurvebank.org/ prime/ prime.htm. Alternatively, you can try a WEB SEARCH on keywords such as 'primes distribution plot'. ----
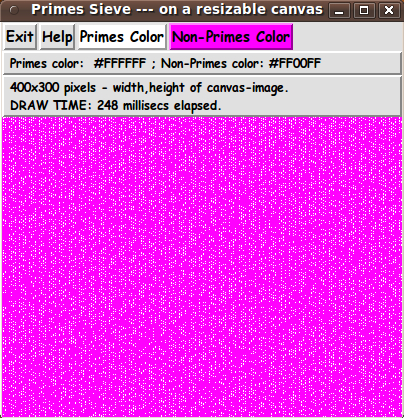
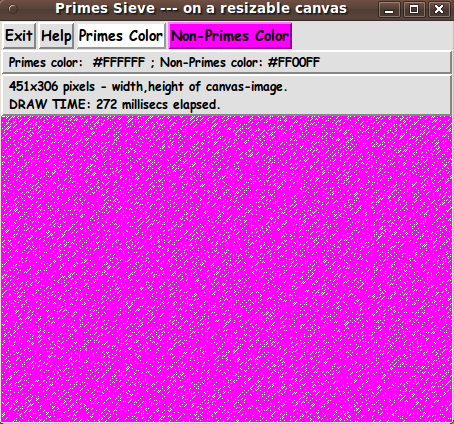
Another aspect of the distribution of the primes in the rectangle
that surprised me is that there seem to be columns of non-primes
in the image (vertical strips of the non-prime color, across the
image) For an example, see the magenta-colored image near the top of this page. And by dragging the window to other widths, those columns of solid color turn into diagonals. For some canvas widths, the columns and diagonals of solid color disappear altogether as the 'on' (prime) pixels seem to be distributed pretty evenly throughout the rectangle. For examples, see the following two images. |
![]()
|
A prime numbers expert can probably explain why these phenomena
occur in this type of display of the distribution of the primes (See the 'UPDATE 2016jul07' section below for some interesting, headache-relieving observations.) Discussions of the Riemann zeta function --- an important construct in prime number studies --- give me headaches like that.
I may steer away from scripts having to do with the zeta function.
SOME POTENTIAL ENHANCEMENTS: Eventually some other features may be added to this Tk script:
--- There will probably more enhancements that I may think of in the future, although some might be more suitable for putting in a separate Tk script using somewhat different methods. For example, this script makes the image using a 'create image' technique on the Tk canvas --- and building the image from 'horizontal scanlines' of colors --- one pixel-color for each integer. Another method would be to use 'create rectangle' commands on the Tk canvas --- one rectangle for each integer. I may put that technique in a separate Tk script someday. NEXT INTERACTIVE / ANIMATED MATH PROJECTS One of the first ideas that I had for an interactive and/or animated Tk script that demonstrates some mathematical principles was to provide Tk scripts that demonstrate the Pythagorean relationship --- the sum of two (geometric) squares on the sides of a right triangle being the area of a 3rd square on the hypotenuse. In 1940, a mathematician named Loomis published a book that showed more than 300 proofs of the Pythagorean theorem. I plan to write Tk scripts that provide an interactive and/or animated demonstration of at least two or three of those proofs of the Pythagorean theorem. --- Even more geometry scripts On several pages of this FE web site, I have expressed thanks to Keith Vetter who I consider to be the Martin Gardner of Tcl/Tk --- based on the many code samples that he has provided on the Tcler's wiki. I particularly like Vetter's plane geometry theorem demos and gear-and-mechanism animations on the Tk canvas. His code contributions inspire me to try to live up to his many-years of creating interesting Tk GUI's --- like his Morley's Miracle demo, which involves surprising properties of special points within triangles. I hope to add some scripts of that type to the FE 'tkGooies' system. IN CONCLUSION There's a lot to like about a utility that is 'free freedom' --- that is, no-cost and open-source so that you can modify/enhance/fix it without having to wait for someone else to do it for you (which may be never). As I have said on other 'tkGooie' pages of this FE web site ... A BIG THANK YOU to Ousterhout for starting Tcl-Tk, and a BIG THANK YOU to the Tcl-Tk developers and maintainers who have kept the simply MAH-velous 'wish' interpreter going. UPDATE 2016jul07: Ever since I released the code for this script in 2013, I have been meaning to enhance the GUI to provide a couple of 'scale' widgets so that the user can precisely control the size of the image area --- the horizontal (x) pixels and the vertical (y) pixels --- in the Tk 'canvas'. This would be significant improvement over having the user control the 'canvas' widget size by resizing the GUI window. And I planned to add horizontal and vertical scrollbars to the canvas, so that the user can examine the extreme edges of a very large image. Three years later, I have finally returned to that script and added those features and more. The main updates:
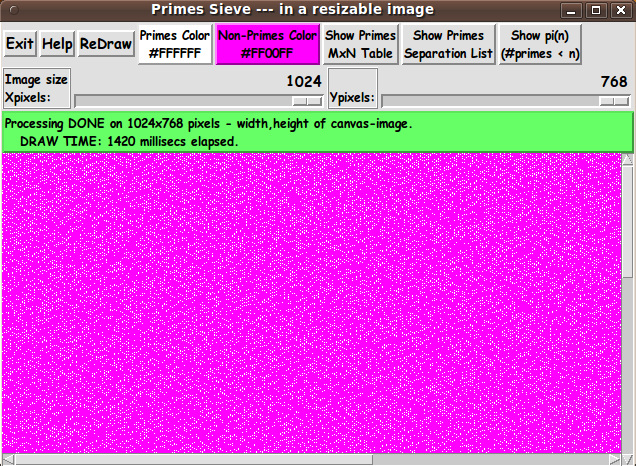
In addition to these main additions, I updated (and improved) the comments in the code --- and I updated the help-text shown by the 'Help' button. Below is an image of the new GUI. Note the 2 new 'scale' widgets and 4 new 'button' widgets. |
|
When the GUI first comes up, the canvas (image) area is blank and there is a message on the GUI indicating that the Eratosthenes procedure is being used to generate an array (indexed by the first million or so integers) which indicates which of the integers is a prime number. The canvas image remains blank during a 2nd phase, during which an intial image is built and placed on the canvas. When that phase is complete, the GUI looks like the image above. Note that the message area indicates that the 1024x768 image was built in about 1.5 seconds on my medium-powered desktop computer. The 1st phase --- building the 1024x768 = 786,432 element array using the Eratosthenes procedure --- completed in a similar amount of time --- less than 2 seconds. --- Around 2015, I was reading a mathematical-recreations book and ran across the fact that if you list the integers in rows of length 6, the primes are confined to two of the 6 columns --- and 4 of the columns consist completely of non-primes (if you ignore the first row, which contains the primes 2, 3, and 5). This fact is illustrated by the following table. Note that (after the 1st row), columns 2, 3, 4, and 6 contain only non-primes --- and the primes are confined to columns 1 and 5. |
  1   2*  3*  4   5*  6
  7*  8   9  10  11* 12
 13* 14  15  16  17* 18
 19* 20  21  22  23* 24
 25  26  27  28  29* 30
 31* 32  33  34  35  36
 37* 38  39  40  41* 42
 43* 44  45  46  47* 48
 49  50  51  52  53* 54
 55  56  57  58  59* 60
 61* 62  63  64  65  66
|
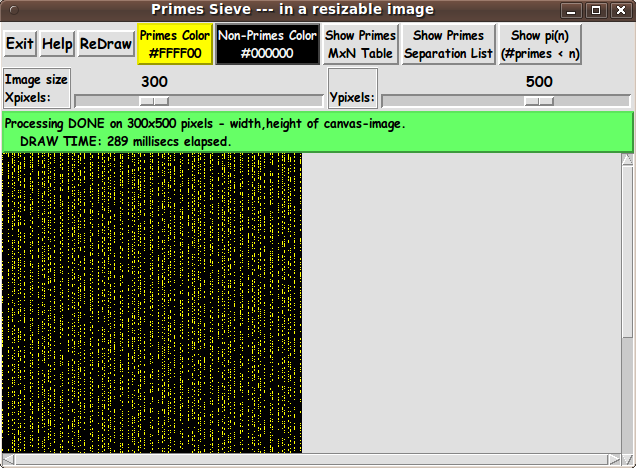
This suggests that, with the GUI X-scale widget, whenever you specify an image size in which the number of X-pixels (columns) is a multiple of 6, in the redrawn image, there should be vertical strips in the non-primes color (which appears to be a 'background' color). Here is an image in which the colors have been changed --- to yellow for the primes and black for the 'background' (non-primes) --- and the image width has been requested to be 6 x 50 = 300 pixels. Note the vertical strips of black. |
|
Note that by requesting a relatively small image size --- 300x500 pixels --- the time to draw the image was reduced to less than 0.3 seconds. And you can use the vertical scroll bar to see the bottom of the image. --- Note that you can use the 'Show pi(n)' button to generate 2 columns of integers that can be captured in a text file. Then that text file can be edited (to remove or comment out the header and trailer text) and fed into a 'tkGooie' plot utility --- like the one at to get a plot of the pi(n) function. --- I have replaced the code at the code link above with the updated Tk script code. The updated code will probably appear in a late-2016 release package of the FE 'tkGooies' system. The code will be accessible via the 'MATHed' (math education) sub-toolchest of the 'MATHtools' toolchest. |
|
Bottom of this page for To return to a previously visited web page location, click on the Back button of your web browser a sufficient number of times. OR, use the History-list option of your web browser. OR ...
< Go to Top of Page, above. >Page history: The code was created in 2013 --- and posted 2013 Jul 05 at http://wiki.tcl.tk/38283.
This FE web page was created 2014 May 16.
NOTE: |