FE 'tkGooies' Utilities
'MATHed' subgroup of
the 'MATHtools' group

Tcl-Tk script 'tkNapoleons Theorem'

(Code for a GUI to
demonstrate that
the center points
of 3 equilateral
triangles set on the
sides of ANY triangle
ALWAYS form an
equilateral triangle)
(FE = Freedom Environment)

GUI which allows the
user to drag the
vertices ABC of a
'central' triangle
and watch that
the centers of the
equilateral triangles
set on sides of that
'central' triangle
ALWAYS form an
equilateral triangle.

FE Home Page > FE Downloads Page >

FE 'tkGooies' Description Page >

FE 'tkGooies' 'MATHtools' Menu >

FE 'tkGooies' 'MATHed' Menu >

This
'tkNapoleonsTheorem'
tk-GUI code Page

INTRODUCTION to Tcl-Tk script
'tkNapoleonsTheorem'

For several years (circa 2013-2015), I had been planning to make various 'Math Education' Tk GUI's that illustrate various discoveries that have been made through the ages --- in plane geometry, number theory, etc.

In the 2013-2016 time frame, I started making a few 'tkGooies' of these types:

In my readings of various books popularizing math and, in particular, books containing discoveries in plane (Euclidean) geometry, such as

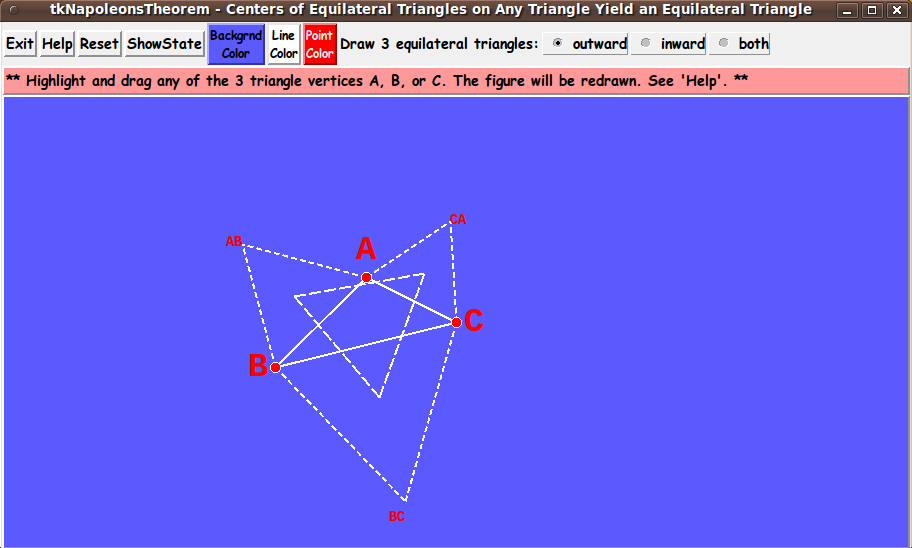
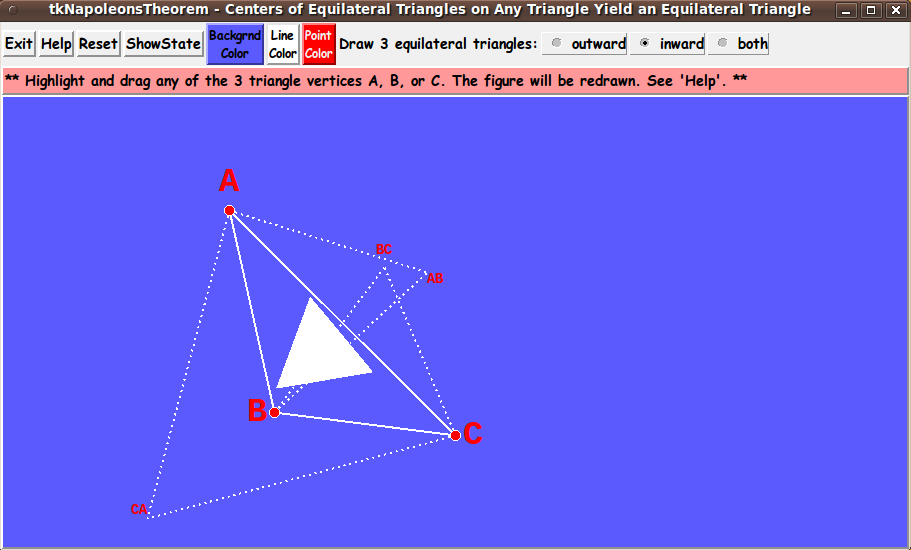
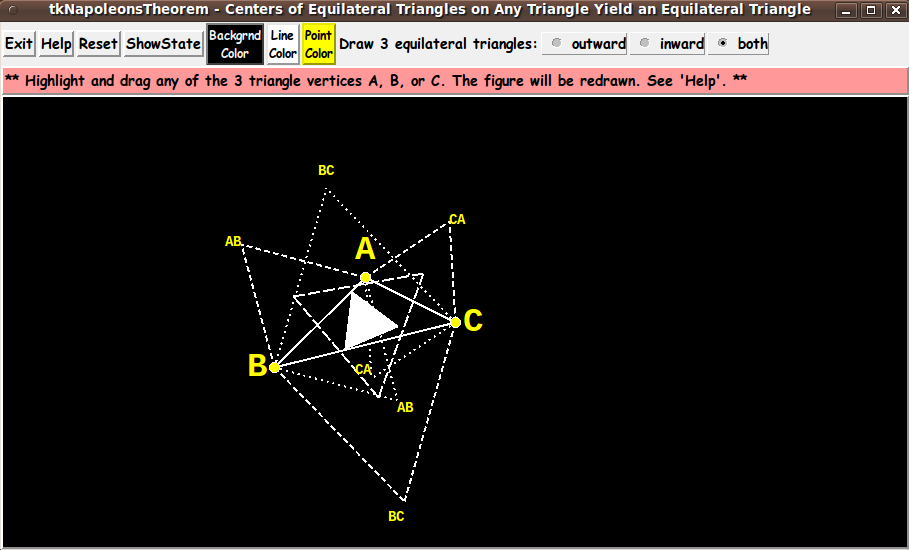
I ran across static images that demonstrate Napoleon's Theorem --- namely, the fact that if you connect the center points of 3 equilateral triangles drawn on the 3 sides of ANY triangle, the resultant triangle is an equilateral triangle.

You can see some such images on the Wikipedia page on Napoleon's Theorem --- a theorem, published around 1820, that may not have been discovered by Napoleon.

    (I am rather surprised that, in the 2000 years during which Euclid's 'Elements', circa 300 BCE, had been widely circulated, nobody was known to have commented on this phenomenon.

    Of course, it is not easy to explore what happens with the center points of 3 equilateral triangles on an arbitrary triangle without doing a lot of tedious drawings --- or manufacture a device to demonstrate this 'feature' of triangles and center points.)

If you want more information on Napoleon and the discovery about center points of equilateral triangles on an arbitrary triangle, you can do a WEB SEARCH on keywords like

If you can deal with the annoying popups and advertisements, one web site that is rife with math results is the 'Cut The Knot' site --- which has a page on Napoleon's Theorem.

In any case, with the Tk script (whose code is presented on this page), I was seeking to make the demonstration of Napoleon's Theorem an interactive and dynamic, animated experience --- using Tcl-Tk.

    Around 2016, with the advent of Javascript enhancements associated with HTML 3.0, some dynamic, interactive demos of math results started appearing on the internet, such as the 'Wolfram Demonstrations Project'.

    Here is an animated demonstration of Napoleon's Theorem at 'demonstrations.wolfram.com'.

    In addition, the Wolfram 'MathWorld' site has a couple of 'static image' pages on the 'Outer Napoleon Triangle' and the 'Inner Napoleon Triangle'.

One feature of the 'tkGooie' presented on this page is that it comes bundled within a 'tkGooies' menu-driven system that can be installed on a computer --- or on a file server that serves files to multiple computers.

    Another feature of the 'tkGooies' is that I generally provide more control of colors than one sees in many math demo utilities.


Basic Goals of the Tk Script:

My purpose for this Tk GUI script is/was to generate a triangle and 3 equilateral triangles on that triangle --- and connect the center points of the 3 equilateral triangles with straight line segments.

The drawings are to be done in a resizable rectangular image area --- in a Tk 'canvas' widget.

The GUI is to allow the user to drag the 3 corners (vertex points) of the 'original' triangle.

And the GUI is to automatically delete-and-redraw (for the user) any changed center points --- and delete-and-redraw the resulting 'Napoleon' triangle (and show that it is equilateral).


PLANNED LAYOUT OF THE GUI:

As I have done with other Tk scripts that I have written in the past year or so, I laid out a 'text image' of the GUI --- to aid me as I coded the frames and widgets.

I used the following conventions to make the sketch, with a text editor.


  SQUARE-BRACKETS indicate a comment (not to be placed on the GUI).
  BRACES          indicate a Tk 'button' widget.
  A COLON         indicates that the text before the colon is on a 'label' widget.
  <---O--->       indicates a Tk 'scale' widget (if any).
  CAPITAL-X       indicates a Tk 'checkbutton' widget (if any).
  CAPITAL-O       indicates a Tk 'radiobutton' widget (if any).
  UNDERSCORES     indicate a Tk 'entry' widget (if any).


  According to those conventions,
  I created the following 'text sketch'.


 FrameNames
 VVVVVVVVVV
              -----------------------------------------------------------------------------
              tkNapoleonsTheorem
              [window title]
              -----------------------------------------------------------------------------

 .fRbuttons   {Exit} {Help} {Reset} {ShowState} {Backgd  {Line   {Point   Draw 3 equilateral triangles: O outward  O inward  O both
                                                 Color}   Color}  Color}
 
 .fRmsg       [ .......... Message line --- for advice to the user .................. ]

 .fRcanvas    -----------------------------------------------------------------------------
              |                                                                           |
              |                                                                           |
              |                                                                           |
              |  [Canvas for displaying the triangles                                     |
              |   in a rectangular image area. No scrollbars.]                            |
              |                                                                           |
              |                                                                           |
              |                                                                           |
              |                                                                           |
              -----------------------------------------------------------------------------


Perhaps some aspects of the sketch could use a little more explanation:


  A combination of VERTICAL-BAR CHARACTERS AND HYPHEN (or UNDERSCORE) CHARACTERS,
  that outline a RECTANGULAR SHAPE, are used to indicate either a Tk 'canvas' or
  a Tk 'listbox' widget or a Tk 'text' widget.

  A LINE (HYPHENS or VERTICAL-BARS) WITH AN 'ARROW-HEAD' AT EACH END indicates
  a Tk 'scale' widget --- or a 'scrollbar' widget.

  SCROLL-BAR 'ARROW-HEADS' (for a 'canvas', 'listbox', or 'text' Tk widget)
  are drawn as follows:

   UP    ARROW-HEAD   is drawn with a CAPITAL-A.
   DOWN  ARROW-HEAD   is drawn with a CAPITAL-V.
   LEFT  ARROW-HEAD   is drawn with a LESS-THAN sign.
   RIGHT ARROW-HEAD   is drawn with a GREATER-THAN sign.

  UP-and-DOWN    ARROW-HEADS  at the right/left of a box shape indicate
  a VERTICAL SCROLL-BAR there.

  LEFT-and-RIGHT ARROW-HEADS  at the bottom/top of a box shape indicate
  a HORIZONTAL SCROLL-BAR there.

  The arrow-heads on a horizontal scrollbar are joined by hyphens, rather than
  underscores.


From the diagram above, I could see that this GUI will contain about:

  • 7 'button' widgets
  • 3 'radiobutton' widgets (in one group)
  • 2 'label' widgets
  • 1 'canvas' widget (with no x-y scrollbars)
  • 0 'entry' widgets
  • 0 'checkbutton' widgets
  • 0 'scale' widgets
  • 0 'listbox' widgets
  • 0 'text' widgets

Assembling the pieces
(The GUI)

Now it was a matter of putting the pieces together.

I took 'code-pieces' from some of my other Tk scripts that 'draw' in an image area on a Tk canvas --- in particular, from my Varignon's Theorem script.

I ended up with the following GUI as an initial display.

Note that I have provided 3 color buttons on the GUI so that the user can control :

  • the background color of the image area

  • the color of the line-segments of the triangles

  • the color of the vertex points of the 'original' triangle --- as well as the color of text-characters that label those 3 vertices.

The message line just below the color-buttons indicates that the user can drag any of the 3 corner-points (A,B,C) of the 'original' triangle.

By default, the GUI starts with an initial triangle --- with 3 'outer' equilateral triangles drawn on its 3 sides.

And the 3 center-points of the 3 equilateral triangles are connected, yielding an 'outer' Napoleon triangle.

A 'ShowState' button at the top of the GUI displays a popup text window that contains numerical information:

  • coordinates of the 'original' ABC triangle
    (in 'pixel units')

  • coordinates of the 'peak' points of the 3 equilateral triangles that are drawn on the 'original' triangle
    (in 'pixel units')

  • lengths of the 3 sides of the 'original' triangle and lengths of the 6 added sides of the 3 equilateral triangles
    (in 'pixel units')

  • lengths of the 3 sides of the 'Napoleon' triangle
    (in 'pixel units').

    These 3 lengths are always equal --- which confirms that the triangle formed by connecting the center-points of the 3 equilateral triangles is also an equilateral triangle.

---

Below is an image that was drawn by requesting 'inward' equilateral triangles, instead of 'outward' equilateral triangles --- by clicking on the 'inward' radiobutton.

    Because the image gets rather 'busy' when 'inward' triangles are drawn, the 'inner' Napoleon triangle is drawn as a color-filled polygon, instead of with 3 line-segments.

---

Below is an image drawn by clicking on the 'both' radiobutton --- to cause both 3 'outer' and 3 'inner' equilateral triangles to be drawn on the 'original' triangle.

Furthermore, both the 'outer' and 'inner' Napoleon triangles are drawn --- based on the 6 center points of the 3 'outer' and 3 'inner' equilateral triangles.

In addition, the background color was changed to black, and the color of the colored-disks representing the points (and the text labelling the points) was changed to yellow.

    Note that you may want to change the canvas background to white if you are going to capture the image and print it to a printer.

    This will save a lot of ink.

---

Execution time:

After dragging a vertex (A, B, or C), the computations and drawing complete almost immediately after completing the drag (releasing the mouse-button, for example).

Wouldn't Napoleon (and Euclid and Archimedes and Galileo and Newton and Euler and the Bernoulli's and Gauss and Cauchy and Weierstrass and Poincare and Riemann and ...) have loved to be able to use Tcl-Tk?

I wonder what wonders Napoleon (or his mathematician countrymen --- such as Laplace and Lagrange and Gaspard Monge and Joseph Fourier --- some of whom accompanied Napoleon on some of his campaigns, for example, to Egypt) would have performed with the 'wish' interpreter at their disposal?

Sure beats drawing in the sand --- or drawing with quill and ink-well.

---

Distance units

When I started writing this script, I considered specifying the coordinates of the various vertex points in 'world coordinates' --- and then mapping those coordinates to pixel coordinates --- as I have done in other geometry 'tkGooies' such as

But the user does not need to be aware of an origin and a coordinate system when dragging the points.

So I decided to perform all the computations within the 'Napoleon Theorem' script based on 'pixel coordinates' rather than 'world coordinates'.

Hence, the 'ShowState' option shows all point locations and length computations in 'pixel coordinates'.

---

Implementing the Color Buttons

The 3 color buttons call on an 'external' color-selector-GUI script to set those colors.

You can make that color-selector script by cutting-and-pasting the code from the page that offers

a non-obfuscated color selector GUI

on this site.

You can see the code at the bottom of this 'tkNapoleonsTheorem' script to see how the name and location of the color selector script is set.

You can put the color-selector script in the same directory as the 'tkNapoleonsTheorem' script.


DESCRIPTION OF THE CODE

Below, I provide the Tk script code for this 'tkNapoleonTheorem' 'app'.

I follow my usual 'canonical' structure for Tk code, for this Tk script:


  0) Set general window & widget parms (win-name, win-position,
     win-color-scheme, fonts, widget-geometry-parms, win-size-control).

  1a) Define ALL frames (and sub-frames, if any).
  1b) Pack   ALL frames and sub-frames.

  2) Define & pack all widgets in the frames, frame by frame.
              Within each frame, define ALL the widgets.
              Then pack the widgets.

  3) Define keyboard and mouse/touchpad/touch-sensitive-screen action
     BINDINGS, if needed.

  4) Define PROCS, if needed.

  5) Additional GUI initialization (typically with one or more of
     the procs), if needed.


This Tk coding structure is discussed in more detail on the page A Canonical Structure for Tk Code --- and variations.

This Tk coding structure makes it easy for me to find code sections --- while generating and testing this script, and when looking for code snippets to include in other scripts (code re-use).


Experimenting with the GUI

As in all my scripts that use the 'pack' geometry manager (which is all of my 100-plus Tk scripts, so far), I provide the four main 'pack' parameters:

  • '-side'
  • '-anchor'
  • '-fill'
  • '-expand'

on all the 'pack' commands for the frames and widgets.

I think I have found a good setting of the '-side', '-anchor', '-fill', and '-expand' parameters on the 'pack' commands for the various widgets of this GUI.

In particular ...

The 'canvas' widget will expand/contract appropriately when the GUI window size is changed --- and button, radiobutton, and label widgets stay fixed in size and relative-location when the window is re-sized.

    If anyone wants to change the way the GUI configures itself as the main window size is changed, they can experiment with the '-side', '-anchor', '-fill', and '-expand' parameters on the 'pack' commands for the various widgets --- to get the widget behavior that they want.

---

Additional experimentation with the GUI
--- its appearance:

You could change the fonts used for the various GUI widgets.

For example, you could change '-weight' from 'bold' to 'normal' --- or '-slant' from 'roman' to 'italic'.

Or change font families.

    In fact, you may NEED to change the font families, because the families I used may not be available on your computer --- and the default font that the 'wish' interpreter chooses may not be very pleasing.

Furthermore, there are variables used to set geometry parameters of widgets --- parameters such as border-widths and padding.

And the '-relief' values for frames and widgets are specified.

Feel free to experiment with those 'appearance' parameters as well.


Some features of the code

There are plenty of comments in the code to describe what most of the code-sections are doing.

See the top of the 'PROCS' section of the script for a list of the procs used in this Tk script.

See comments in the procs for details on the purpose of each proc and for details on the methods by which each proc was implemented.

Below is a quick overview of the procs --- to give an idea of the 'guts' of this utility:


    'initDraw'           - This proc is called in the 'Additional GUI
                           Initialization' section at the bottom of this
                           script to put an initial drawing of an 'original'
                           triangle and 3 'outer' (and/or 'inner') equilateral
                           triangles --- and the 'outer' (and/or 'inner')
                           'Napoleon' triangle --- on the canvas.

    'reset'              - This proc clears the canvas and runs 'initDraw'.
                           Called by the 'Reset' button and some bindings.

 The following 3 procs handle moving an 'origial' triangle vertex point
 --- any of the 3 points called A,B,C.

   'pointSelect'      - called by a button1-press   binding on an 'OrigTri'-point-tag of the canvas.
   'pointMove'        - called by a button1-motion  binding on the canvas.
   'pointMoveEnd'     - called by a button1-release binding on an 'OrigTri'-point-tag of the canvas.

 The following 3 procs handle redrawing the various triangles, points, and text
 --- for a move of point A, B, or C.

   'redraw4movedA'    - called by proc 'pointMoveEnd', to delete and redraw the points,
                        lines, and text affected by moving point A.
   'redraw4movedB'    - called by proc 'pointMoveEnd', to delete and redraw the points,
                        lines, and text affected by moving point B.
   'redraw4movedC'    - called by proc 'pointMoveEnd', to delete and redraw the points,
                        lines, and text affected by moving point C.

   'show_state'        - reports on the state of the current image:
                           - the coordinates of the 3 'original-triangle' vertex points - A,B,C
                           - the coordinates of the 3 'peak' vertex points of the 3
                             'base' equilateral triangles - points AB,BC,CA -
                             'outward' or 'inward',
                           - the lengths of the 3 sides/line-segments of the 'original triangle'
                           - the lengths of the 6 other sides of the 'base' equilateral
                             triangles --- 'outward' or 'inward'
                           - the coordinates of the 3 centers of the 3 'base' equilateral
                             triangles --- 'outward' or 'inward'
                           - the lengths of the 3 lines/sides connecting the 3 centers of the
                             3 'base' equilateral triangles --- 'outer' or 'inner' triangles
                           - the area of the 'outer-centers' triangle, and
                             the area of the 'inner-centers' triangle, and
                             the difference of the 2 areas, if both the 'outer-centers' and
                             the 'inner-centers' triangle are drawn.
                         Called by the 'ShowState' button.

  'area_triangle_3points'  - returns the area of a triangle for coordinates of 3 vertices.
                             Called by the 'show_state' proc.

 Other utility procs:   

  'set_background_color'    - Sets the color for the canvas (background).
                              Called by the 'BackgroundColor' button.
 
  'set_line_color'          - Sets the color for the circle on the canvas.
                              Called by the 'LineColor' button.
 
  'set_point_color'         - Sets the color for the inscribed polygon.
                              Called by the 'PointColor' button.
                              
  'update_button_colors'    - Sets the color of the 3 color buttons.
                              Called by the 'set_*_color' procs.

  'advise_user'             - Used by various procs to put a message for
                              the user on a message line of the GUI.        

  'popup_msgVarWithScroll'  - called by 'Help' button to show HELPtext var.


The initial drawing on the canvas is performed by the 'initDraw' proc.

See the comments in that proc to see how it is implemented.

The procs 'pointSelect' and 'pointMove' handle displaying a moving point on the canvas when the user drags any of the 3 points A,B,C.

The proc 'pointMoveEnd' handles redrawing the figure when the user finishes dragging any of the 3 points A,B,C.

The proc 'pointMoveEnd' uses proc 'redraw4movedA' or 'redraw4movedB' or 'redraw4movedC' to redraw the image on the canvas --- depending on which point was moved.


A fervent hope

It is my hope that the copious comments in the code might help Tcl-Tk coding 'newbies' get started in making GUI's like this.

Without the comments --- especially in the 'initDraw' and 'point*' and 'redraw*' procs --- the code might look even more cryptic than it already is.

Without the comments, potential young Tcler's might be tempted to return to their iPhones and iPads and iPods --- to look for videos of TV news organizations interviewing politicians and their 'surrogates' (and NOT asking obvious follow-up questions).

Examples:

  • For politicians who do not want to show their recent income tax forms (because they are still being audited) --- some follow-up questions that are never asked:

    • If you will not show recent forms, why not show forms from several years ago? Those are not being audited. (There is a limitation on the number of years back that tax submissions can be audited.)

    • A certain 2016 presidential nominee was being audited --- and so was Warren Buffet.

      Warren Buffet offered to reveal his tax return line by line to the public, if the presidential nominee (rhymes with 'stump') would do so also.

      Warren Buffet has shown that it is quite possible to show tax returns that are being audited.

      The question should repeatedly be asked:
      When will you sit down with Warren Buffet and compare tax returns?

  • For a 2016 presidential nominee (rhymes with 'dump') who refers to Elizabeth Warren as 'Pocahontas' --- questions never asked by the media:

    • Don't you think you are insulting American Indians when you use 'Pocahontas' as if it is a derogatory term?

      Are you willing to do that because American Indians are a very minor voting block?

      Would you use similar derogatory names to a particular Latino or African-American or Jewish person --- when Latino and African-American and Jewish voting blocks are much more needed by you than the American Indian vote?

  • For Debbie Wasserman Schulz of the Democratic National Committee --- questions never asked by the media:

    • Is it the case that you used your position as head of the Democratic National Committee to funnel donated funds to Hillary Clinton's primary campaign --- with essentially no funds going to Bernie Sanders' primary campaign?

      Is it the case that you funneled other resources (people-time, etc.) to Hillary and not Bernie?

      Don't you think you owe Bernie an apology for your dirty tricks?

Potential Tclers:

When you get tired of looking at devoid-of-common-sense TV-interviews-with-politicians-and-the-like, try installing-using-changing-enhancing the following Tk GUI script.

To help out in making scripts like this, here is

a page that provides sources of Tcl-Tk code snippets

by providing links to various 'tkGooies' scripts that can make it relatively quick work to compose

  • widget definitions,
  • bind statements, and
  • procedure code.

And when you get to the testing-and-debugging phase in development of a script, here is

a page that describes the wonderfulness
of the 'wish' 'stack trace' facility
,

which can make the testing-and-debugging go relatively quickly and painlessly.


The Tcl-Tk Script CODE

Here is a link to CODE for the Tk script

'tkNapoleonsTheorem.tk'.

With your web browser, you can 'right-click' on this link --- and in the menu that pops up, select an option like

' Save Link Target As ... '

to save this file to your local computer.

Then you can rename the file to remove the '.txt' suffix.

Make sure that you have execute permission set on the file --- in order to execute the script.

Some possible FUTURE ENHANCEMENTS

There are quite a few enhancements that could be considered for this script, such as:

  1. As a vertex point is dragged, draw the changing triangles :

    Given that the image is so quickly redrawn when the mouse-button is released after dragging a point, it appears that it may be possible to delete-and-redraw the triangles as a point is dragged.

    This would amount to putting the calls to the 3 'redraw*' procs into the 'pointMove' proc, instead of only the 'pointMoveEnd' proc.

  2. Put some observations directly on the canvas or message line :

    The fact that the 'outer' and 'inner' Napoleon triangles are indeed equilateral is 'buried' on the 'ShowState' report.

    It would probably be more user-friendly to expose the lengths of the sides of the Napoleon triangles directly on the GUI --- somehow (on the canvas or in label widgets).

    It would also be nice to 'expose' (on the GUI) the fact that the area of the 'original' triangle ALWAYS equals the difference between the 'outer' and 'inner' Napoleon triangle areas.

  3. A 'Write-AniGIF' option:

    If it were desirable to 'record' the points being dragged and the images being redrawn, the GUI could offer an option to write an animated-GIF file (or movie file) from a sequence of images generated from the canvas.

    It would certainly be more convenient than having to do a bunch of image captures and manually contruct an animated-GIF (or movie) file from a sequence of still-image captures.

    I have implemented a Write-Ani-GIF option in several 'tkGooies' in the 'IMAGEtools' group, such as:

    I can use code from one or more of those Tk scripts to make it relatively easy to implement a Write-Ani-GIF option --- although I might have to do some sort of Postscript to GIF conversion.

The bottom line here is that there are almost always non-trivial enhancements that could be made to --- or 'forks' that could be made from --- a Tk GUI 'app' like this.

One advantage of this Tk script is that it is 'open' code --- available to anyone for enhancement.

So if you would like to take a different approach to implementing this script, you are welcome to take this code and build on it (or reconstruct it).


IN CONCLUSION

As I have said on other code-donation pages on this site ...

There's a lot to like about a utility that is 'free freedom' --- that is, no-cost and open-source so that you can modify/enhance/fix it without having to wait for someone else to do it for you (which may be never).

A BIG THANK YOU to Ousterhout for starting Tcl-Tk, and a BIG THANK YOU to the Tcl-Tk developers and maintainers who have kept the simply MAH-velous 'wish' interpreter going.

Bottom of this web page for
presenting Tcl-Tk code for
'tkNapoleonsTheorem'
--- a Tk-GUI-script 'app'
in the FE 'tkGooies' system,
in the 'MATHed' subgroup
of the 'MATHtools' group.

To return to a previously visited web page location, click on the Back button of your web browser a sufficient number of times. OR, use the History-list option of your web browser.
OR ...

< Go to Top of Page, above. >

Page history:

This FE web page was created 2016 Oct 04.

Page was changed 2016 Oct 07.
(Added about 7 links.)

Page was changed 2019 Mar 05.
(Added css and javascript to try to handle text-size for smartphones, esp. in portrait orientation.)

Page was changed 2019 Jul 03.
(Specified image widths in percents to size the images according to width of the browser window. Also fixed some web links.)


NOTE:
This code and description has not been posted on a Tcler's Wiki page --- at wiki.tcl-lang.org --- formerly wiki.tcl.tk.

If I ever do so, as a backup and alternative to this page, I plan to add a link to that page here.