FE 'tkGooie' Utilities

'PLOTtools' group

tkGnuplotXY_ upto3mathExpressions

a GUI 'front-end' for 'gnuplot'

(FE = Freedom Environment)

An XY plot from
this FE 'tkGooie'
'front end' to 'gnuplot'
---
which plots up to 3
user-specified math
expressions in a
single plot

FE Home Page > FE Downloads Page >

FE 'tkGooies' Description Page >

FE 'tkGooies' 'PLOTtools' Menu >

This 'tkGnuplotXY_ upto3mathExpressions'
tkGooie code Page

INTRODUCTION to
Tcl-Tk code for a
'tkGnuplotXY_upto3mathExpressions' app

On 2015 October 07, I provided a Tk script that uses 'gnuplot' to plot data from 2 or 3 columns of data in a file.

I provided that 'gnuplot' 'front-end' Tk script at a 'tkGnuplotXY_file2or3cols' page of this site.

On that page, I pointed out that it may be 2016 or so before I get around to getting some auto-plot-scaling and auto-ticmarking code into releasable form --- in some pure-Tcl-Tk 'PlotQuik' scripts that are on my 'to-do' list.

I need to make that autoscale and auto-ticmarking code more robust (and modular).

So, as a relatively quick-to-implement alternative, I decided to make some Tk GUI 'front-ends' for the popular, widely-available 'gnuplot' program --- some plot utilities for

  1. XY plots of 2 or 3 columns of data from a data file

  2. XY plots from math expressions of the form f(x)

  3. bar charts from a data file

  4. 3D surface plots from math expressions of the form g(x,y)

  5. one or two other 'gnuplot' front ends

The Tk script for item 1 above is posted in the page whose link is above.

On this page, I present the code of a Tk script for item 2 above.

The code is presented further below.


THE GOALS

I had some general goals for the Tcl-Tk 'front-end' script for this GUI.

Those goals were shaped by the capabilities of the 'gnuplot' program with regard to specifying and plotting math expressions.

As I proceeded in the coding and testing, my knowledge of the capabilities of 'gnuplot' with regard to math-expression-plotting advanced, and some of my goals were augmented or altered.

Here are the main goals to which I gravitated.

  • Provide entry fields for up to 3 math expressions --- to be plotted on a single graph.

  • To make it easy for a user to get started plotting, provide a listbox (on the left of the GUI), from which the user can select sample math expressions --- to put in the up-to-3 expression entry fields.

    The user can simply change coefficients and do a plot --- or more drastically change a selected math expression.

  • Provide 3 entry fields so that the user can tailor the plot title, and the x-axis and y-axis titles, as desired.

  • Provide a row of buttons at the top of the GUI with labels such as 'Exit', 'Help', 'RePlot', and several color buttons to allow for setting some color options that are available with 'gnuplot'.

  • Provide 3 radiobuttons at the top of the GUI (labelled 1, 2, and 3) by which the user can specify which of the 3 expression entry fields is to receive the expression, selected by the user, from the listbox.

  • Provide 4 entry fields so that the user can specify min and max values for the x and y axis scales.

    (Initialize each of these fields to an asterisk ... * ... which is to signal to 'gnuplot' to autoscale --- i.e. tells 'gnuplot' to automatically choose the min and max axis-extent values --- those mins and maxes which are indicated by an asterisk instead of a number.)

  • Provide radiobuttons for some of the output ('terminal type') options of 'gnuplot' --- GIF, PNG, JPEG, PS (Postscript color), PSbw (Postscript black-and-white), SVG (Scalable Vector Graphics), and WXT (a high-quality terminal type).

    In addition, provide a 'Test' button next to the radiobuttons, to take advantage of a 'gnuplot' ability to put out a 'test image' for any of the 'terminal types' --- showing the line-types and text orientation options and other options for the terminal type.

  • Provide 2 entry fields by which to specify the size of the image output (x-pixels, y-pixels).

  • Provide 3 radiobuttons by which to specify which type of plot to render: lines-only, point-symbols-only, or both lines-and-points.

  • Provide 3 entry fields, corresponding to each math-expression, by which to specify any of the 29 or so line types that 'gnuplot' provides. ('gnuplot' seems to only support these line types, as dashed lines, in Postscript output --- color or black-and-white.)

  • Provide X and Y entry fields, by which to specify an angle by which to orient the X and Y tic-mark-labels on the axes.

    Default both to 0. But '-45' can be handy for long labels on x-tic-marks.


THE GUI LAYOUT

Like for some other Tk GUI scripts that I posted here at freedomenv.com, I made an initial 'text-sketch' for the GUI for this 'gnuplot' 'front-end' utility.


  CONVENTIONS for the GUI 'text-sketch' below:

   * SQUARE-BRACKETS indicate a comment not to be included on the GUI.
   * BRACES indicate a Tk 'button' widget.
   * UNDERSCORES indicate a Tk 'entry' widget.
   * A COLON indicates that the text before the colon is on a 'label' widget.
   * CAPITAL-O indicates a Tk 'radiobutton' widget.
   * CAPITAL-X indicates a Tk 'checkbutton' widget (if any).
   * Vertical bars (and horizontal hyphens) outline a 'listbox' widget.
   * Less-than and greater-than signs indicate the left and right ends of a horizontal 'scrollbar'.
   * Capital-V and Capital-A letters indicate the bottom and top ends of a vertical 'scrollbar'.


  Here is the sketch:


  FRAMEnames
  VVVVVVVVVV
              ------------------------------------------------------------------------------------------
              Gnuplot of up to 3 math expressions:
              [window title]
              ------------------------------------------------------------------------------------------

  .fRbuttons  {Exit} {Help} {RePlot} {Color of  {Color of      {Color of   Load Expression: O 1  O 2  O 3
                                      Lines}     background}     axes} 
    
               [.fRbottom FRAME contains the '.fRleft' and 'fRright' FRAMES]

               [ '.fRleft' FRAME   [ '.fRright FRAME'
                    is below ]         is below and to the right ]
  [FRAMES below
  are in .fRright
  -------------]

  .fRexpr1     |---------------A Expression1: _________________________________________________________
               |               |
  .fRexpr2     |   [ This      | Expression2: _________________________________________________________
               |   listbox     |
  .fRexpr3     |   contains    | Expression3: _________________________________________________________
               |    math       |
  .fRtitle     | expressions ] | Plot title: __________________________________________________________
               |               |
  .fRxaxis     |               | XaxisMin:______  XaxisMax:_______ XticLabelsAngle: ___  _____X-axis label______
               |               |
  .fRyaxis     |               | YaxisMin:______  YaxisMax:_______ YticLabelsAngle: ___  _____Y-axis label______
               |               |
  .fRlinetypes |               | Expr1LineType(1-29): __   Expr2LineType(1-29): __   Expr3LineType(1-29): __  
               |               |
  .fRplotopts  |               | PlotType: O Line  O Point  O Both          LineWidth(1-6): 1
               |               |
  .fRoutopts   |               | ImageOutType: O GIF   O PNG  O JPG  O PS  O SVG  {TestImg}  Xpixels: 800__  Ypixels: 600__ 
               |               |
  .fRmsg       |<------------->V [ ..........  Messages go here  ......................................................]


From the GUI 'sketch' above, it is seen that the GUI is to consist of about

  • 7 button widgets
  • 19 label widgets
  • 17 entry widgets
    (3 more could be added to specify tic-mark interval)
  • 11 radiobutton widgets in 3 groups
  • 1 listbox widget with 2 scrollbars
  • 0 checkbutton widgets
  • 0 scale widgets
  • 0 text widgets
  • 0 canvas widgets

Here is an image of the GUI that I ended up with for a 'first release'.


Poke this image to see the image
in a separate window or tab.

This is a little different from how the GUI appears when it intially appears.

I had clicked on the 'Clear' button --- so a function, sin(x), that was in the 'Expression1' entry field was blanked out.

Also I had done a plot, so you see the names of a couple of files (the gnuplot script file and the output image file) in the message line at the bottom of the GUI.

It is also worth noting that by clicking the 'Autoscale' button, an asterisk is put into the four min,max entry fields.

These asterisks are used to tell 'gnuplot' to automatically determine all four limits from the data chosen.

As I use this utility, I may find that I want to alter the GUI somewhat. If I make some significant changes, I intend to replace the script file here with the new file.

Anyone who wants to take the code on this page and alter the GUI to meet their needs is welcome to do it.

This Tk GUI script is meant to be an actual 'productivity' tool (not a toy) --- a free and open-source tool --- a tool that is open to enhancement and 'tweaking'.


DESCRIPTION OF THE CODE

Below is a link to the code that produced this GUI.

I follow my usual 'canonical' structure for Tk code, for this Tk script:


  0) Set general window & widget parms (win-name, win-position,
     win-color-scheme, fonts, widget-geometry-parms, win-size-control).

  1a) Define ALL frames and sub-frames.
  1b) Pack   ALL frames and sub-frames.

  2) Define & pack all widgets in the frames.

  3) Define keyboard or mouse/touchpad/touch-sensitive-screen
     action BINDINGS, if needed.

  4) Define PROCS, if needed.

  5) Additional GUI initialization (typically with one or more of
     the procs), if needed.


This Tk coding structure is discussed in more detail on the page A Canonical Structure for Tk Code --- and variations.

This makes it easy for me to find code sections --- while generating and testing Tk scripts, and when looking for code snippets to include in other Tk scripts (code re-use).


Experimenting with the GUI

As in all my scripts that use the 'pack' geometry manager (which is all of my 100-plus Tk scripts, so far), I provide the four main 'pack' parameters --- '-side', '-anchor', '-fill', and '-expand' --- on all the 'pack' commands for the frames and widgets.

I think I have found a good setting of the '-side', '-anchor', '-fill', and '-expand' parameters on the 'pack' commands for the various widgets of this GUI.

In particular ...

The math-expressions, plot-title, and axis-titles entry widgets expand/contract appropriately when the window size is changed --- and button and label widgets stay fixed in size and relative-location as the window size is changed.

Furthermore, radiobuttons and entry fields for axis-limits, line-width/types, and pixel-sizes stay fixed in size.

If anyone wants to change the way the GUI configures itself as the main window size is changed, they can experiment with the '-side', '-anchor', '-fill', and '-expand' parameters on the 'pack' commands for the various widgets --- to get the widget behavior that they want.

---

Additional GUI experimentation:

You could change the fonts used for the various GUI widgets.

For example, you could change '-weight from 'bold' to 'normal' --- or '-slant' from 'roman' to 'italic'.

Or change font families.

In fact, you may NEED to change the font families, because the families I used may not be available on your computer --- and the default font that the 'wish' interpreter chooses may not be very pleasing.

Furthermore, there are variables used to set geometry parameters of widgets --- parameters such as border-widths and padding.

Feel free to experiment with those parameters as well.

---

Note that the 3 'Color' buttons call on an RGB color-selector-GUI script to set the colors.

You can make that color-selector script by cutting-and-pasting the code from the page offering 'a non-obfuscated color selector GUI', on this site.


Some features of the code

There are plenty of comments in the code to describe what most of the code-sections are doing.

See the 'PROCS' section of the code to see the code in all the procs that are used in this Tk script.

The main plotting code is in the proc 'replot'.

See the comments in that proc for details on how the plotting is implemented by creating a 'gnuplot' script of commands to pass to the 'gnuplot' program.

Here is a list of the procs in this Tk script:

  • listboxSelectionTOexprField
  • clear_expr
  • set_autoscale
  • replot
  • display_test_img
  • edit_inputs
  • getset_color
  • update_color_button
  • popup_msgVarWithScroll

Although it may sound like stating the obvious, it is probably worth mentioning that the 'listboxSelectionTOexprField' proc is called by a button1-release binding on the listbox --- and the 'replot' proc is called by the 'RePlot' button --- and the 'getset_*_color' procs are called by the 'Color' buttons.

In a late addition to the GUI, I added the 'clear_expr' and 'set_autoscale' procs.

The 'clear_expr' proc is called by the 'Clear' button, and the 'set_autoscale' proc is called by the 'Autoscale' button.

The 'update_*_color_button' procs are called near the bottom of the Tk script to initialize the GUI, after initializing some color variables.

And those 'update' procs are also called in the 'getset_*_color' procs.

Just a few more comments on some 'features' of this script:

  1. EditInput:

    The 'edit_input' proc is called by the 'replot' proc to check the entries on the GUI --- that they are the proper numeric type, in the proper range, etc.

    If there is an exception, the 'popup_msgVarWithScroll' proc is used to popup a message to the user.

    The 'popup_msgVarWithScroll' proc is also called by the 'Help' button to show the text in the 'HELPtext' variable, which is set at the bottom of the script.

  2. Output Display:

    'gnuplot' typically renders the plot into an output file in a fraction of a second.

    Some 'viewer' variables are used in this Tk script to set the viewer program to use for the various output types. I have set variables as follows:

    • set GIFviewer "/usr/bin/eog"
    • set PNGviewer "/usr/bin/eog"
    • set JPGviewer "/usr/bin/eog"
    • set PSviewer "/usr/bin/evince"
    • set SVGviewer "/usr/bin/inkscape"

    where 'eog' is the 'Eye of Gnome' image file viewer utility.

    'evince' is a PDF and Postscript file viewer.

    Inkscape is an SVG editor. Inkscape is slow to open.

    It might be just as fast to use a web browser, like Firefox, as the SVG viewer.


Comments in the Code

It is my hope that the copious comments in the code will help Tcl-Tk coding 'newbies' get started in making GUI's like this.

Without the comments, potential young Tcler's might be easily frustrated and be tempted to return to their iPhones and iPads and iPods --- to watch a politician try to speak in complete, sensible sentences --- and fail repeatedly. (Who elects these people?)


The Tcl-Tk script CODE

Here is a link to CODE for the script 'tkGnuplotXY_upto3mathExpressions.tk'.

You may find it instructive to see the variables set, in an 'Additional GUI Initialization' section near the bottom of the Tk script --- above the setting of the 'HELPtext' variable at the very bottom of the script.

That section is where you can reset the viewers to be used, and change the middle-names and directory locations for the output files (gnuplot script and image files).

The 'HELPtext' variable is set at the bottom of the script so that it can display the values of some of the variables that were set --- for example, the filename that was set for the output 'gnuplot' script file --- and the 'filename-prefix' that was set to be used in creating the name of an output gif/png/jpg/ps/psbw/svg file.

Of course, if you need to change a directory name or want to change a middle-name for these files, you can simply change the 'set' statements that affect those names.


Other 'gnuplot' utilities

This is the second of several 'gnuplot front-end' utilities that I plan to write.

Other Tk 'gnuplot front-end' scripts that may follow are:

  1. bar chart, created from data in a file

  2. math expression 3D-surface-plot, created from an expression entered on the GUI

  3. points and/or lines xy-plot, created from data entered on the GUI --- for the case of a small number of points to plot, and the user does not want to take the time (or whatever) to put the data in a file

  4. a many-y-values xy-plot, created by selecting many columns of data, say, up to 10, from a text file containing columns of data --- extracting text-strings from the file, strings that are names that can be used for a plot 'key' (legend) for the many lines on the plot.
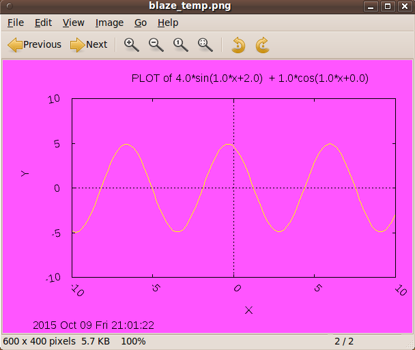
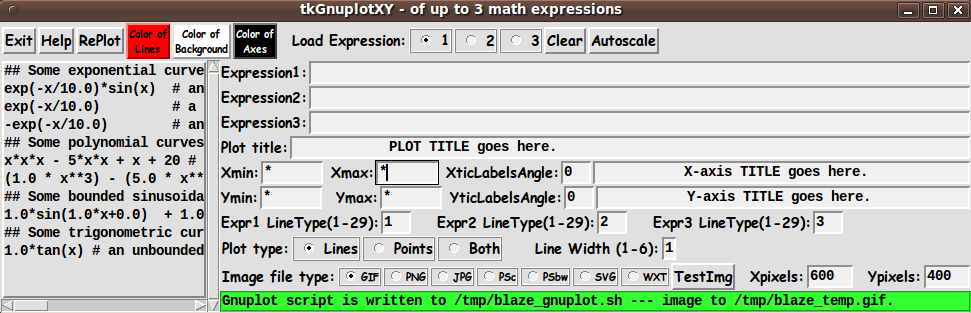
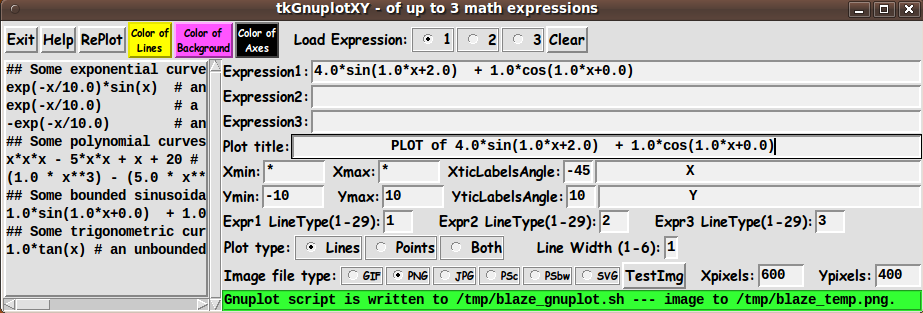
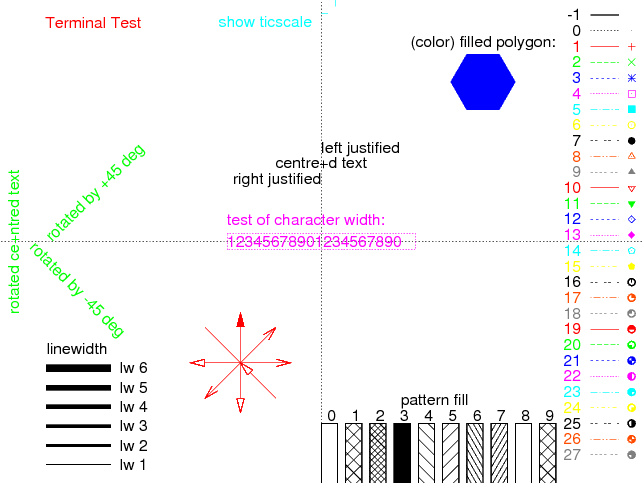
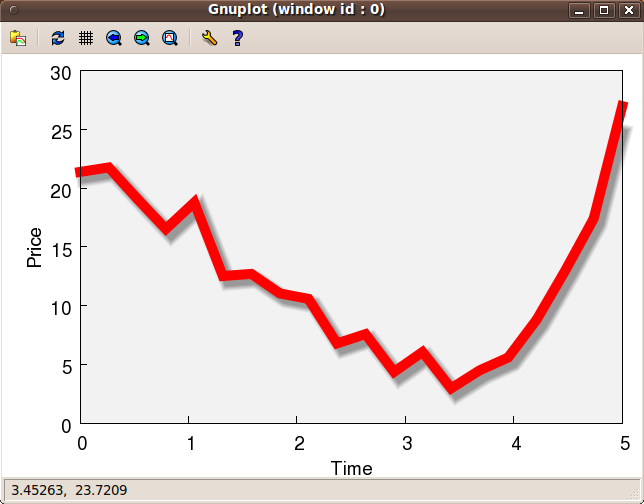
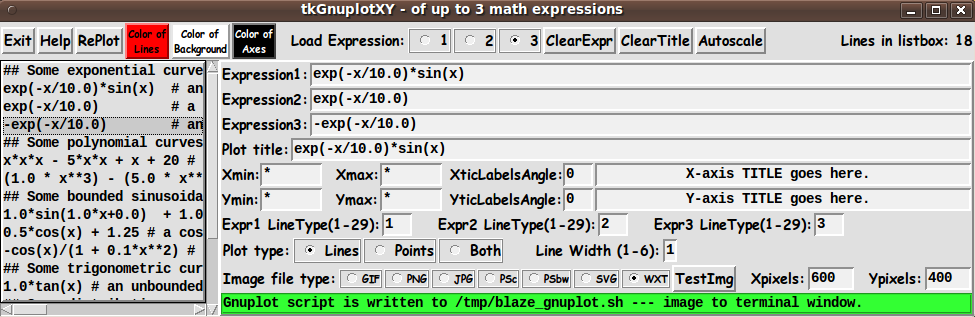

A Sample 'Run':

Below is output from one of my test runs.


This is the 'eog' image file viewer utility
showing the plot of a linear combination of
sine and cosine functions, in a PNG file.

(I know. I should have chosen a better
color combination --- or at least used a
wider line width for the yellow.
Next time.)


The above plot colors (background-magenta and
plot-line-yellow) were set by this GUI.
You can see that the 'Color' buttons are colored
according to their current color setting.

This is what the 'update_*_color_button'
procs are for.

(Poke this image to see the image
in a separate window or tab.)

Sample terminal output from the gnuplot 'test' command:

For those who have not seen the output of the 'test' command of 'gnuplot', for various terminal types, below are several images:


This is 'gnuplot' 'test' command output was put in a
'.gif' file, because 'terminal gif' was requested.

NOTE:
All the line types are solid colors --- no dashes.
The same is true for 'terminal png' and 'terminal jpeg'.
Their output looks almost identical to this.


This is 'gnuplot' 'test' command output was
put in a '.ps' color-Postscript file, because
'terminal postscript landscape color colortext'
was requested.

NOTE:
Many dashed line types are available
when terminal postscript-color is requested.


This is 'gnuplot' 'test' command output was
put in a '.ps' monochrome-Postscript file, because
'terminal postscript landscape mono blacktext'
was requested.

NOTE:
Many dashed line types are available
when terminal postscript-mono is requested.

The two Postscript 'gnuplot-test' images above were
displayed on Linux with the 'evince' PDF/Postscript viewer.

Each of those screen images were captured with the
'gnome-screenshot' program into a PNG file.

The PNG file was cropped with the 'mtpaint' image
editor program. The 'mtpaint' program saves to quite
large PNG files, so the 'pngcrush -brute' command
was used to minimize the PNG file size.


This is 'gnuplot' 'test' command output that was
displayed in a 'gnuplot' 'wxt' terminal, after
'terminal wxt persist' was requested.

NOTE: No dashed line types.

This screen capture of the 'wxt' terminal window
was done with the 'gnome-screenshot' program,
to a '.png' file.

The wxt terminal uses the wxWidgets library,
which is where the 'wx' comes from.

The actual drawing is done via Cairo,
a 2D graphics library, and Pango,
a library for laying out and rendering text.

Below is the gnuplot script file that was created and executed after clicking on the 'TestImg' button with GIF output selected.

Notice the simple 'test' command.


    #!/usr/bin/gnuplot ! cd /tmp set terminal gif size 600 , 400 set output '/tmp/${USER}_temp.gif' test ! /usr/bin/eog /tmp/${USER}_temp.gif &

Future Enhancements:

I have not tested this Tk-GUI script extensively. No doubt, if I use it some more, I will find a few things to change, add, or fix.

I MAY add more example functions to the listbox, someday.

Furthermore, as I point out at the bottom of the 'HELPtext', someday I may try to get more appealing plots --- with color gradient backgrounds and with 'shadow curves' and with 'ribbon curves' --- by using some of the 'gnuplot tricks' of Zoltan Voros, that can be seen at 'www.phyast.pitt.edu/~zov1/' in

In case those pages disappear, here are a couple of images that show what Zoltan was able to achieve --- using some tricky 'gnuplot' commands:


A color-gradient background done with
'gnuplot' commands, to a 'wxt' terminal.


A 'shadow curve' plot done with
'gnuplot' commands, to a 'wxt' terminal.

This just goes toward showing:

There is just no end to what can be done, to enhance almost any utility.

UPDATE - 2015oct14:

I have replaced the Tcl-Tk code at the link above with code that implements a few minor enhancements.

Main changes are:

  • Added some math expressions to the listbox, and added a label at the top-right of the GUI to show the number of lines in the listbox --- to indicate to the user the number of expressions that may be out of sight in the listbox.

  • Made some changes to get some entry fields to line up precisely, along vertical lines.

  • Added a 'ClearTitle' button and renamed the 'Clear' button to 'ClearExpr'.

  • Updated the HELPtext variable with some info on the SVG, PSbw, and WXT output options --- and some info on the intended use of the 'ClearTitle' button.

  • This does not show on the GUI, but, internally, I consolidated

    • 3 'getset_*_color' procs to one 'getset_color' proc, and

    • 3 'update_*_color_button' procs to one 'update_color_button' proc.

    I also removed some unused procs and code.


You can see an image of the new GUI when it first comes up, just below --- with 3 math expressions in the 3 expression entry fields.

Note that although the GUI looks quite 'busy', when it first comes up, the user can simply click the 'RePlot' button to immediately get a plot, using the initial GUI settings.

Then the user can start changing parameters to get at a desired plot.

I know that many operating systems are going for an 'ultra-clean' look --- hiding most options.

That is frustrating to me.

For one thing, it is typically not clear where to look to find ANY of the operating options, even a Help option.

I prefer having as many options 'exposed' as possible.

I do not like clicking through drop-down menus trying to find options.

Having the options exposed to immediate usage means many fewer clicks during a work session.


Below is the gnuplot script file that was created in one of my test runs.

Note the f(x), g(x), and h(x) functions.


    #!/usr/bin/gnuplot ! cd /tmp set terminal wxt persist title "WXT terminal window" set title 'exp(-x/10.0)*sin(x)' set timestamp '%Y %b %d %a %H:%M:%S' set xlabel ' X-axis TITLE goes here.' set ylabel ' Y-axis TITLE goes here.' set xrange [ * : * ] set yrange [ * : * ] set xtics rotate by 0 set nomxtics set ytics rotate by 0 set nomytics set xzeroaxis set yzeroaxis set nokey f(x) = exp(-x/10.0)*sin(x) g(x) = exp(-x/10.0) h(x) = -exp(-x/10.0) plot [*:*] f(x) with lines linewidth 1 linecolor rgb '#FF0000' linetype 1 \ , g(x) with lines linewidth 1 linecolor rgb '#FF0000' linetype 2 \ , h(x) with lines linewidth 1 linecolor rgb '#FF0000' linetype 3

This is pretty crisp and clean, compared to all the comments that I have around the Tcl-Tk code that is writing out these gnuplot commands.

Note that by using the Tk GUI, the user can typically avoid having to page back and forth through 'gnuplot' documentation trying to find commands to use and the proper syntax for those commands --- and which parameters to use with those commands.

And the user avoids many syntax errors, because I filtered out the errors that I made during testing, resulting in gnuplot commands that are probably going to work --- with gnuplot 4.2 and thereafter.

Essentially all of a user's documentation searching and syntax debugging is eliminated by use of this Tk GUI.

Bottom of this web page for
presenting Tcl-Tk code for
tkGnuplotXY_ upto3mathExpressions
--- a plot utility in the FE 'tkGooies' system,
in the 'PLOTtools' group.

To return to a previously visited web page location, click on the Back button of your web browser a sufficient number of times. OR, use the History-list option of your web browser.
OR ...

< Go to Top of Page, above. >

Page history:

This FE web page was created 2015 Oct 09.

Page was changed 2015 Oct 14.
(New, updated code.)

Page was changed 2019 Mar 05.
(Added css and javascript to try to handle text-size for smartphones, esp. in portrait orientation.)

Page was changed 2019 Jun 24.
(Specified image widths in percents to size the images according to width of the browser window.)


NOTE:
This code and description has not been posted on a Tcler's Wiki page --- at wiki.tcl-lang.org --- formerly wiki.tcl.tk. If I ever do so, I plan to add a link to that page here --- as a backup and alternative to this page.