FE 'tkGooie' Utilities

'MATHtools' group

tkCompounded GrowthCalculator

(and compounded decay calculator)

(FE = Freedom Environment)

A GUI to QUICKLY 'compound' growth
(or decline) rates,
of dollars, population, etc.
over various time periods.

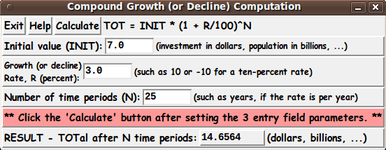
Large, hi-res image is below.

FE Home Page > FE Downloads Page >

FE 'tkGooies' Description Page >

FE 'tkGooies' 'MATHtools' Page >

This
'tkCompoundedGrowthCalculator'
tkGooie code Page

INTRODUCTION to Tcl-Tk script
'tkCompoundedGrowthCalculator'

In the past decade-plus (circa 2000-2015), I have occasionally wished that I had a compounded rate calculation utility (written in Tcl-Tk) so that I could experiment with some

  • mortgage (or other lending) interest rate calculations

  • CD or bank (or other investment) interest rate calculations

  • population growth (and decline) calculations --- human (and other mammals), for example

  • physics calculations involving exponential increase or decay --- such as radiation penetration of different thicknesses of shielding

  • similar calculations in other sciences --- biology, chemistry, math, ...

and be able to change the utility to work as I require.

I wanted to be able to supply several simple parameters:

  • an initial value --- in dollars or in billions of people or whatever

  • a growth (or decline) rate --- a percent, per year or month or second or ...

  • a number of time periods --- in the time units used for the rate.

This year (2016), I finally took the time to make that Tcl-Tk utility.


PLANNED LAYOUT OF THE GUI:

As I have done with other Tk scripts that I have written in the past year or so, I laid out a 'text image' of the GUI --- to aid me as I coded the frames and widgets.

I used the following conventions to make the sketch, with a text editor.


  SQUARE-BRACKETS indicate a comment (not to be placed on the GUI).
  BRACES          indicate a Tk 'button' widget.
  A COLON         indicates that the text before the colon is on a 'label' widget.
                  (Parentheses around some text may also indicate a 'label' widget.)
  UNDERSCORES     indicate a Tk 'entry' widget.
  CAPITAL-O       indicates a Tk 'radiobutton' widget (if any).
  CAPITAL-X       indicates a Tk 'checkbutton' widget (if any).
  <---O--->       indicates a horizontal Tk 'scale' widget (if any).


  According to those conventions,
  I created the following 'text sketch'.


 FrameNames
 VVVVVVVVVV
              -----------------------------------------------------------------------------
              tkCompoundedGrowthCalculator
              [window title]
              -----------------------------------------------------------------------------

 .fRbuttons   {Exit} {Help} {CalculateTotal}
                                 
 .fRinputs1   Initial value: 100.0______ (dollars, population, ...)
      
 .fRinputs2   Growth (or decline)
              Rate (percent):    3.0______ (such as 10 or -10 for a ten-percent rate)

 .fRinputs3   Number of time periods (N): 50___ (such as years, if the rate is per year)

 .fRmsg       [... Messages to the user can be displayed here on a label widget ...]

 .fRresult    TOTal after N
              time periods: [ Calculated result is shown in a text widget here. ]

 [The following 'plot' frames may be implemented in the future.]

 .fRplotcntl  {Plot value of         {Backgd  {Line  {Title-Labels  {TicMarks
               INIT*(1 + R/100)^N}    Color}  Color}  Color}         Color}

 .fRplot      --------------------------------------------------------------------------
              |                                                                        |
              |                                                                        |
              |                                                                        |
              |  ['Canvas' for displaying a plot of  INIT*(1 + R/100)^N  against N.]   |
              |                                                                        |
              |                     [eventually]                                       |
              |                                                                        |
              |                                                                        |
              |                                                                        |
              --------------------------------------------------------------------------


From the diagram above, I could see that this GUI will contain about:

  • 3 'button' widgets (8 eventually, for colors etc.)
  • 8 'label' widgets
  • 3 'entry' widgets
  • 1 'text' widget
  • 1 'canvas' widget (eventually, for plotting)
  • 0 'radiobutton' widgets
  • 0 'checkbutton' widgets
  • 0 'scale' widgets
  • 0 'listbox' widgets

Assembling the pieces
(The GUI)

Now it was a matter of putting the pieces together.

I took 'code-pieces' from some of my other Tk scripts that 'draw' in an image area on a Tk canvas.

    (I plan to implement the canvas area someday.)

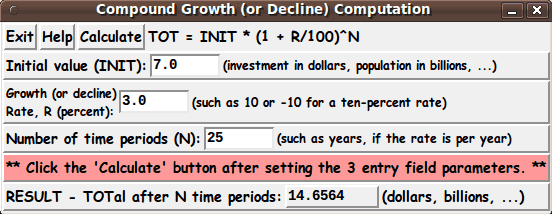
I ended up with the following GUI as an initial display.

For initial values in the 3 entry widgets (INIT, RATE, and NUMperiods) of the GUI, I chose

  • 7.0, representing the current (circa 2015) world population (human), in billions

  • 3.0, a number slightly larger than the current average percent growth in the world population, per year

  • 25, representing a time period of 25 years of human growth, at the specified percentage growth rate per year.

The 14.6564 on the 'RESULT' line, indicates that the world population could be over 14 billion by the year 2015 + 25 = 2040.

The user can experiment with Rates such as 2.0 and 2.5, to see what the expected population would be.

Also experiment with N (the number of time periods).

Change 25 to 10 or 50, to see what the population might be in 2025 or 2065 --- assuming the INIT value was for the year 2015.

Just click on the 'Calculate' button when the 3 parameters have been set as desired.

---

Negative Rates

You can experiment with negative rates.

It could be instructive to estimate the decline in world (or local) populations of large mammals --- those that are not bred and raised by humans for food or races --- mammals such as lions, tigers, elephants, rhinos, hippos, giraffes, dolphins, whales, etc.

However, since these animals do not pay taxes, there have been no regular, comprehensive censuses of these mammals performed over many years --- like there have been for humans, since the Middle Ages, and long before in some regions.

So there is no good data for INIT and for the RATE (negative) to be used in this GUI --- for these large mammals.

Another problem:

The RATE (of population decline) is probably not a fixed rate, to be multiplied by the population at the start of each time period.

Poachers (such as ivory hunters) and whale hunters (such as the Japanese) may actually be killing animals at an accelerated rate --- especially as the human population increases, probably driving the demand for ivory and whale products upward (unless certain people change their ways).

But, in spite of the poor data, a person interested in population declines like these, could use this GUI to perform various 'what if' experiments.

There may be other applications of the GUI involving negative RATEs --- in the fields of finance or physics.

I hope that the readers of this page think of such applications.

That is one of the reasons this code is posted here.

---

Some Numerical Experiments to Try

The Tk script offered on the page

'tkLendersCompoundInterestDreamCrushed_ eIsTheLimit'

offers some compound interest calculations that illustrate the origin of the 'natural number' 'e'.

To keep the demonstration of the relationship of 'e' to compound interest calculations relatively straight-forward, a restricted set of 'base' interest rates and compounding time periods is offered by that GUI.

This 'tkCompoundedGrowthCalculator' GUI can do those calculations and more.

For example, in this GUI, you can examine a scenario of the 'tkLenders' GUI --- calculate a year of interest using 12 compounding periods, assuming a 'base' interest rate of 100 percent per year.

In this GUI, you can enter the monthly interest rate 100/12 = 8.333333 and enter 12 for the number of time periods N.

(Set INIT to 1.0.)

The result is 2.6130 --- corresponding to the 261.303529 percent RESULT from the 'tkLender' GUI.

With this GUI, however, you can change the INIT value --- and choose from a much wider variety of values for rate R and time-periods N.


Implementing some Color Buttons
(for lines-and-background on a canvas)
(eventually, for plotting)

If I ever add a plot option to this GUI, the color buttons will call on an 'external' color-selector-GUI script to set those colors.

You can make that color-selector script by cutting-and-pasting the code from the page that offers a non-obfuscated color selector GUI on this site.

You can see the code at the bottom of the Tk script to see how the name and location of the color selector script is set.


DESCRIPTION OF THE CODE

Below, I provide the Tk script code for this 'tkCompoundedGrowthCalculator' math-education or math-tool 'app'.

I follow my usual 'canonical' structure for Tk code, for this Tk script:


  0) Set general window & widget parms (win-name, win-position,
     win-color-scheme, fonts, widget-geometry-parms, win-size-control).

  1a) Define ALL frames (and sub-frames, if any).
  1b) Pack   ALL frames and sub-frames.

  2) Define & pack all widgets in the frames, frame by frame.
              Within each frame, define ALL the widgets.
              Then pack the widgets.

  3) Define keyboard and mouse/touchpad/touch-sensitive-screen action
     BINDINGS, if needed.

  4) Define PROCS, if needed.

  5) Additional GUI initialization (typically with one or more of
     the procs), if needed.


This Tk coding structure is discussed in more detail on the page A Canonical Structure for Tk Code --- and variations.

This Tk coding structure makes it easy for me to find code sections --- while generating and testing this script, and when looking for code snippets to include in other scripts (code re-use).


Experimenting with the GUI

As in all my scripts that use the 'pack' geometry manager (which is all of my 100-plus Tk scripts, so far), I provide the four main 'pack' parameters

  • '-side'
  • '-anchor'
  • '-fill'
  • '-expand'

on all the 'pack' commands for the frames and widgets.

I think I have found a good setting of the '-side', '-anchor', '-fill', and '-expand' parameters on the 'pack' commands for the various widgets of this GUI.

In particular ...

Button and label and entry widgets stay fixed in size and relative-location if the window size is changed by the user --- and, if I implement plotting (someday), the 'canvas' widget will expand/contract appropriately if the window is resized.

    I allow the window to be resized --- in anticipation of implementing the plotting canvas someday --- and in planning to allow the canvas (the plot) to be resized when the user resizes the GUI window.

If anyone wants to change the way the GUI configures itself as the main window size is changed, they can experiment with the '-side', '-anchor', '-fill', and '-expand' parameters on the 'pack' commands for the various widgets --- to get the widget behavior that they want.

Or they can implement a 'wm' (window manager) command to make the GUI un-resizable. Simply un-comment the line:

wm resizable . 0 0

---

Additional experimentation with the GUI:

You could change the fonts used for the various GUI widgets.

For example, you could change '-weight' from 'bold' to 'normal' --- or '-slant' from 'roman' to 'italic'.

Or change font families.

In fact, you may NEED to change the font families, because the families I used may not be available on your computer --- and the default font that the 'wish' interpreter chooses may not be very pleasing.

Furthermore, there are variables used to set geometry parameters of widgets --- parameters such as border-widths and padding.

And you could change the '-relief' values for frames and widgets.

Feel free to experiment with those 'appearance' parameters as well.


Some features of the code

There are plenty of comments in the code to describe what most of the code-sections are doing.

The main calculations are done in a 'calculate' proc.

See the top of the 'PROCS' section for a list of the procs used in this Tk script.

See comments in the procs for details on the purpose of each proc and for details on the methods by which each proc was implemented.

Here is a quick overview of the procs --- to give an idea of the 'guts' of this utility.


There are five procs in the initial implementation:


  - 'calculate'                 - called by the 'Calculate' button

  - 'edit_inputs'               - called by the 'calculate' proc
  
  - 'decimal_check'             - called by the 'edit_inputs' proc

  - 'advise_user'               - called in the 'Additional GUI Initialization'  
                                  section at the bottom of the Tk script
 
  - 'popup_msgVarWithScroll'    - called by 'Help' button


If I implement plotting, there will be procs like the following:


  *********************
  Drawing utility procs:
  *********************

 'setMappingVars_for_px2wc'  - called by a 'draw_plot' proc.

                               Sets up constants to be used in converting
                               a 'world coordinate' to a 'pixel coordinate'
                               on the Tk canvas.

                        This proc takes the coordinates of an UpperLeft (UL)  
                        point and a LowerRight (LR) point --- in BOTH 
                        'world coordinates' and 'pixel coordinates' and
                        sets some global variables to be used by the
                        other drawing procs --- mainly the ratio:

                        the number-of-pixels-per-world-coordinate-unit,
                        global variable 'PXperWC'

    'Xwc2px'     -  converts an x world-coordinate to pixel units,
                    in various draw-lines and draw-text procs.

    'Ywc2px'     -  converts a  y world-coordinate to pixel units,
                    in various draw-lines and draw-text procs.

  *****************************
  End of Drawing utility procs.
  *****************************

  ***************************
  Color-Button utility procs:
  ***************************

  'set_background_color'    - Called by the background color button.
 
  'set_line_color'          - Called by the plot lines (and points) color button.  
 
  'set_title-labels_color'  - Called by the plot title (and labels) color button.
 
  'set_ticmarks_color'      - Called by the ticmarks color button.

  'update_button_colors'    - Sets the color of the 4 color buttons.

  **********************************
  End of Color-Button utility procs.
  **********************************


To potential Tcler's

It is my hope that the copious comments in the code might help Tcl-Tk coding 'newbies' get started in making GUI's like this.

Without the comments --- especially in the procs --- the code might look even more cryptic than it already is.

Without the comments, potential young Tcler's might be tempted to return to their iPhones and iPads and iPods (and Samsung and other equivalents) --- to look for videos of Japanese whaling ships slaughtering whales --- and to see if anyone is still trying to stop them.

Here is a WEB SEARCH on the keywords 'japanese whale slaughter'.

The lack of effective support from the Australian and New Zealand governments in stopping the slaughter is disgusting.

Empty words is all that the bureaucrats of these governments offer.

Same for the U.S. and China and England and others who should be sending weekly (if not daily) letters of protest to Japan --- with a deadline --- at which time a coalition of Navy ships will intercept the whalers and confiscate their harpoons.

    Since whales do not pay taxes, there are no comprehensive, periodic whale sampling censuses done --- like there have been done for centuries for humans in essentially every country on the planet.

    Without good sampling data on populations of various whale species (in their usual habitats, at several sites on their migration paths, over a period of many years), there is no way to judge how the whale populations are declining (or growing).

    If the Japanese truly wanted to do whale research, they would be doing this kind of data gathering --- rather than slaughtering whales with no apparent care about how many are left.

After you finish writing your letters of protest to the Japanese embassy in your area (or, better yet, after picketing said embassy), please try some coding using the Tcl-Tk 'wish' interpreter.


The Tcl-Tk script CODE

Here is a link to CODE for the Tk script

'tkCompoundedGrowthCalculator.tk'.

With your web browser, you can 'right-click' on this link --- and in the menu that pops up, select an option like

' Save Link Target As ... '

to save this file to your local computer.

Then you can rename the file to remove the '.txt' suffix.

Make sure that you have execute permission set on the file --- in order to execute the script.

Some possible FUTURE ENHANCEMENTS

I have indicated above the plotting enhancement that I am considering adding someday:

  1. Provide an XY plot of   INIT * (1 + R/100)^N   against N

    I have provided the code (frame and widget definitions ; procs) for implementing a major part of this feature --- in the 'initial' code provided above.

    I may return to this 'app' someday and provide the 'draw' procs to put a plot on a Tk 'canvas' widget --- whose size will be determined by the current GUI window size.

    The XY plot would show the data points increasing or decreasing as N goes from 0 to the value of N entered on the GUI.

    A 'WritePlot' button could be added to the GUI to allow for quickly writing out the plot to an image file --- such as a Postscript file.

  2. If I think of other enhancements, I may add them here.

    I have plans to write some Tk GUI's for simulating population dynamics involving non-linear equations --- such as equations for predator-prey scenarios or human-self-extinction scenarios (war, disease --- localized or world-wide).

    But trying to incorporate those kinds of population simulations into this utility would require making the GUI --- and the PROCS section --- and the HELP text --- too messy.

    So I will devise separate GUI's for those kinds of simulations.

One advantage of this Tk script is that it is 'open' code --- available to anyone for enhancement.

So if you would like to take a different approach to implementing compounded growth (and decay) calculations, you are welcome to take this code and build on it.


IN CONCLUSION

As I have said on several other code-donation pages on this freedomenv.com site and on the Tclers' wiki at wiki.tcl.tk ...

There's a lot to like about a utility that is 'free freedom' --- that is, no-cost and open-source so that you can modify/enhance/fix it without having to wait for someone else to do it for you (which may be never).

A BIG THANK YOU to Ousterhout for starting Tcl-Tk, and a BIG THANK YOU to the Tcl-Tk developers and maintainers who have kept the simply MAH-velous 'wish' interpreter going.

Bottom of this web page for
presenting Tcl-Tk code for a
'tkCompoundedGrowthCalculator' 'app'
--- in the FE 'tkGooies' system,
in the 'MATHtools' group.

To return to a previously visited web page location, click on the Back button of your web browser a sufficient number of times. OR, use the History-list option of your web browser.
OR ...

< Go to Top of Page, above. >

Page history:

This FE web page was created 2016 Mar 25.

Page was updated 2016 Mar 28.
(Added some text and some links.)

Page was changed 2019 Mar 04.
(Added css and javascript to try to handle text-size for smartphones, esp. in portrait orientation.)

Page was changed 2019 Jul 01.
(Specified image widths in percents to size the images according to width of the browser window.)


NOTE:
This code and description has NOT been posted on a Tcler's Wiki page --- at wiki.tcl-lang.org --- formerly wiki.tcl.tk. If I ever do so, as a backup and alternative to this page, I plan to add a link to that Wiki page here.