FE 'tkGooie' Utilities

'3Dtools' group

3D Terrain
Generator-and-Examiner,
from Image File input

(FE = Freedom Environment)

FE 'tkGooie' interface for a
terrain generator from an
image file
---
the user can specify a
GIF or PNG file
---
and write out a
Wavefront OBJ file

FE Home Page > FE Downloads Page >

FE 'tkGooies' Description Page >

FE 'tkGooies' '3Dtools' Page >

This 3D Terrain Generator-and-Examiner (from images) Page

INTRODUCTION to a
3D Terrain Generator-and-Examiner,
using Image File input

On a web page of this FE site that provides code for a '3D Examiner for functions of 2 variables', I pointed out that I found a couple of 3D model viewing Tcl-Tk scripts quite inspiring --- two scripts of 'MBS' (Mark Stucky) and 'GS' (Gerard Soohaket) that they provided at wiki.tcl.tk --- under the titles

  • '3dviewer : A canvas only viewer of 3D data'

and
  • '3D polyhedra with simple tk canvas', respectively.

I resolved to make a similar 3D viewer --- but with MUCH enhanced 3D model import options and some other enhancements.

I resolved to support reading and examining models from ASCII file formats such as Wavefront OBJ, Stereolithography STL, Cyberware PLY, Geomview OFF, and at least one CAE(FEA) file format.

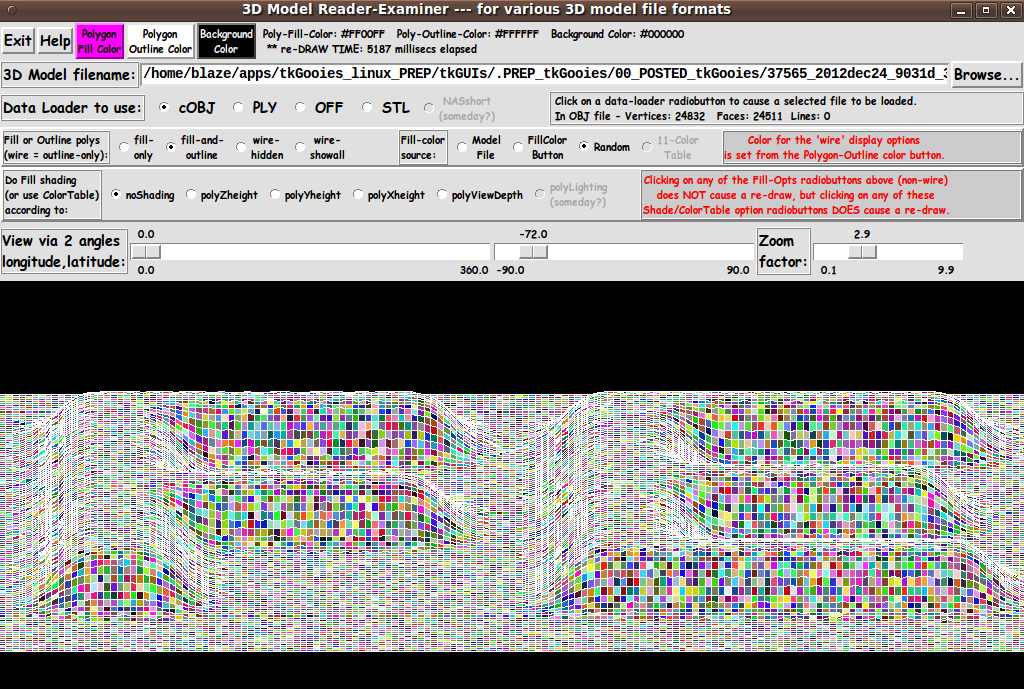
I published the code for such a model-file-reader-and-viewer at wiki.tcl.tk/37565 under the title 'A 3D Model File Loader-and-Examiner - for OBJ, PLY, OFF, STL, FEA files'.

With that 3D reader-viewer utility --- whose code I have also published on this freedomenv.com site --- an unlimited number of 3D models can be viewed.

At the bottom of the page presenting that reader-viewer, I mentioned that my next project would be to make a 3D terrain generator-and-viewer. That is the subject of this page.

I pointed out that one difference in the terrain utility would be that it reads an image file instead of an ASCII 3D model file.

There were a few capabilities that were shown 'grayed out' (not yet implemented) in the 3D reader-viewer utility --- such as a polygon-coloring-from-a-color-table option and a shading-by-lighting option.

I resolved to get those options working in the terrain utility --- so that I could then 'back-port' those capabilities into the 3D OBJ/PLY/OFF/STL reader-viewer utility.

In a sense, the terrain utility would be a step back in capability. The 3D OBJ/PLY/OFF/STL reader-viewer utility handles model files with polygons with 1,3,4,5,6,7,8,9,10,... sides, where 1 = line-segments.

For the terrain viewer, I would need to handle only 4 sided polygons (or 3).

Before making the 3D OBJ/PLY/OFF/STL reader-viewer utility, I took some 'baby steps' toward building that viewer by developing two somewhat less ambitious 3D surface viewers --- whose code I published at the wiki.tcl.tk pages titled

Those two viewers dealt only with displaying 4-sided polygons.

So in a sense, the terrain generator utility would be a 'step back' to less-generalized handling of polygons, like in these two utilities.

In the first of these '2 variables' viewers, I presented code for a Tk GUI that allows for examining surfaces generated over a rectangular grid in the x-y plane --- by generating the z-values of points on the surface, over a rectangular grid, from a function of x and y --- z=f(x,y).

In that script, I established a lot of procs that I could use for other 3D viewers.

In particular, I provided a proc to rotate the coordinates of '3D point clouds'.

In the second of these 2 pages/scripts, I devised a proc for polygon-sorting according to a 'z-depth'.

So those two 3D viewer projects provided a lot of the code that I needed to make the 3D model-file viewer.

In those two 3D viewer projects, I got fairly good display of surfaces using 4-sided polygons (possibly non-planar) without having to use 3-sided (planar) polygons.

So I decided to stick with 4-sided polygons (rather than triangles) for this first attempt at a terrain generator and viewer.

In making the terrain generator-viewer, I could adapt code from all 3 of the previously written 3D viewers to make the viewing part of the utility.

I could also use the same kind of 'arrays-of-lists' points and polygons storage architecture that I used in the 3 previous 3D viewers.

One of the new challenges would be to work out the logic of loading the RGB values of the pixels of an image into those storage arrays.

Another challenge would be to provide a 'write-OBJ' option so that the generated terrain could be saved in a popular 3D model file format.


MY GOALS:

I decided to make a 3D terrain generating-and-viewing utility that included the following features.

1) ROTATION METHOD:

Like in my other three 3D viewers, I would allow the user to specify 'longitude' (yaw) and 'latitude' angles to specify the view direction (or to rotate the surface).

I would use Tk 'scale' widgets so that setting the 2 view angles can be done quickly and redraw is initiated immediately.

I would use 'button1-release bindings' on the scales to cause the redraw as soon as a scale change is complete.

    (I may eventually add bindings to mouse events on the canvas, like <Motion>, so that the view rotation can be done even more quickly and conveniently.

    This would be similar to rotate/zoom/pan controls that Mark Stucky provided in a 3D model viewer that he published at wiki.tcl.tk/15032 under the title '3dviewer : A canvas only viewer of 3D data'.)

2) DATA ENTRY:

Instead of having one entry field for the function f(x,y) --- or 3 entry fields for functions f(u,v), g(u,v), h(u,v) --- or one entry field for the name of an OBJ/PLY/OFF/STL file, I would have an entry field for a image filename --- along with a 'Browse...' button by which to navigate to and select a file in the computer's directory structure.

I used GIF files for my testing and screen captures, since I am running Tcl-Tk 8.5 --- not 8.6.

Those who are running 8.6 could verify whether this utility also works well for PNG files.

In any case, one can find an unlimited variety of GIF files that would be suitable for generating terrains.

Even if restricted to GIF files, we will have the ability to generate an unlimited variety of terrains.

3) COLOR CHOICES:

I would allow color choices (again, like in the other three 3D viewers I have posted here) for

  • polygon fill
  • polygon outline
  • canvas background

from among 16 million colors, each.

4) DISPLAY OPTIONS:

I would provide radiobuttons by which the type of model display could be chosen:

  • 'fill-only' of polygons

  • 'fill-and-outline' of polygons

and two 'outline-only' options:

  • 'wireframe-hidden'

  • 'wireframe-show-all'
    (even the polygons 'in back').

5) ZOOM OPTION:

I would (again) provide a 'zoom' Tk 'scale' widget, by which the plot can easily be resized, down or up --- to make sure the entire plot can be seen on the canvas.

Like with the 2 scales for the longitude-latitude view angles, I would use a 'button1-release' binding on the zoom scale to cause the redraw to be initiated as soon as a scale change is complete.

6) MATH (COORDINATE AXES) APPROACH:

In the 3D OBJ/PLY/OFF/STL reader-viewer script I used a z-axis out of the screen and a y-axis in the 'up' direction --- for the 'fixed, viewing' coordinate axes.

For this terrain utility, I returned to using a z-axis in the 'up' direction, just as I used in the two '2-variable surface' plotting Tk scripts.

Specifically, for 'fixed, viewing' axes in this terrain viewer:

  • positive z-axis is 'up'
    (parallel to the monitor screen)

  • positive y-axis is 'to the right'
    (parallel to the monitor screen)

  • positive x-axis is 'out of the screen'
    (perpendicular to the monitor screen).

Rotations of the generated terrain surface could be given by an Ry * Rz rotation matrix product --- where Rz is applied to a point-vector first.

Based on that math, the 'longitudinal' ('yaw') view angle specifies a rotation around the z-viewing-axis and the 'latitudinal' ('pitch') view angle specifies a rotation around the y-viewing-axis --- which has been rotated around the z-axis.

We are avoiding 'roll' --- rotation around the x axis (perpendicular to the z and y axes) --- a third kind of rotation. It is too disorienting.

'Roll' is for fighter jet simulations and for emulating an acrobatic sky diver doing flips and all manner of rotations in mid-air. After all ...

When we examine an object, like a dining table, we walk around it ('yaw') and we may put our eyes somewhat above or below the table top ('latitudinal rotation') --- but we generally do not stand on our head to examine it.

7) 'PAINTING' THE POLYGONS (SORTING):

For the viewer of parametric surfaces given by 3 functions of u and v, I needed to implement a procedure for sorting the polygons (quadrilaterals) before drawing them.

I also needed to use a polygon sorting procedure in the 3D OBJ/PLY/OFF/STL reader-viewer utility.

For that 3D utility, I took the sorting utility for the parametric surface viewer and enhanced it to handle N-gons, where N = 1,3,4,... --- not just 4-gons (quadrilaterals).

Now, however, for this terrain viewer utility, it is much more like the 3D viewer for a function of 2 variables z=f(x,y).

That is, with this terrain viewer, I would again be dealing with 'single-valued' functions over a rectangular grid.

(We are not generating terrains with caves or overhangs.)

So I could use the 'painting' technique that I used in the f(x,y) surface generator-and-viewer utility --- a technique of starting the 'painting' from the 'far corner' of the rectangular grid.

To have the ability to choose other sorting methods, I decided to provide radiobuttons on the GUI so that a variety of sorting methods could be tried out.

(I may 'back-port' those buttons to the 3D OBJ/PLY/OFF/STL viewer utility.)

---

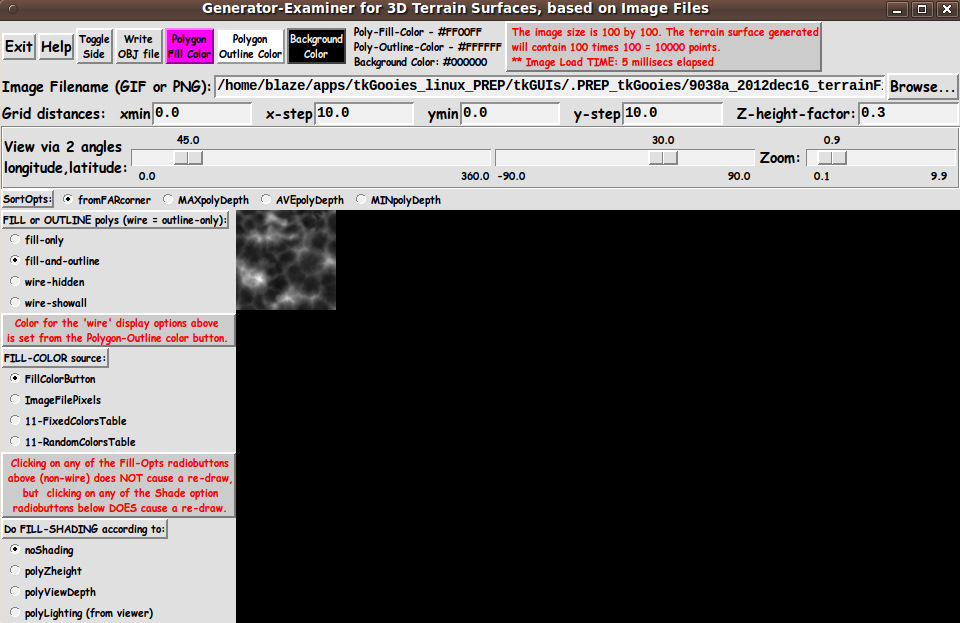
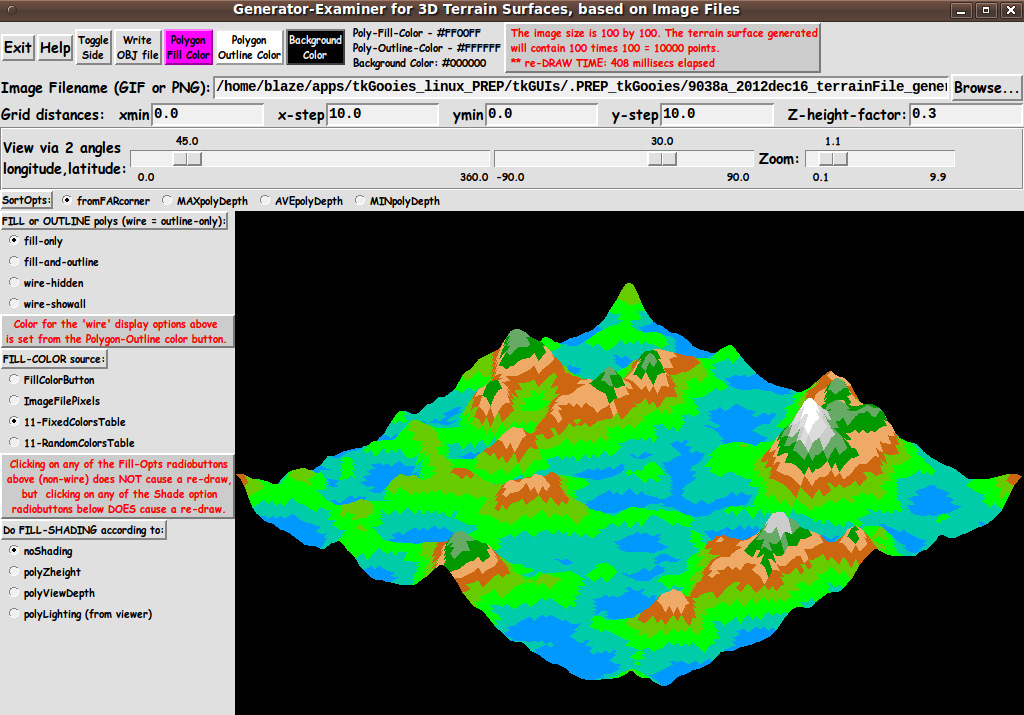
In aiming to accomplish these goals, I ended up with the GUI seen in the following image.

When started up, the GUI first appears with a blank entry field for the image filename.

The image above demonstrates that when you select an image file with the 'Browse...' button, after closing the Tk OpenFile GUI utility, you are returned to this GUI and the image is shown in the upper left corner of the Tk canvas.

The following image shows that when you trigger one of the events that causes the image file to be 'plotted' --- for example, clicking with MouseButton3 on the filename entry field --- a terrain is generated from the image file.

And the following image shows that you can pick up the colors from the pixels of the image file (grays in this case) to color the polygons of the terrain.

Note the 'radiobutton' group titled 'FILL-COLOR source:'.

The radiobutton titled 'ImageFilePixels' is selected.

In these images, you can see the three buttons for color-setting, across the top of the GUI --- 'Fill', 'Outline', and 'Background'.

In the frame below the color-buttons frame, you can see the entry field for an image filename --- along with a 'Browse...' button.

Below that frame, you can see the frame for entry fields by which the user can specify 'grid-distances' to convert the x,y pixel locations into 'world coordinates' for the rectangular grid which is the 'domain' of the terrain surface --- xmin, x-step, ymin, y-step.

Also in that frame is a 'z-height-factor' to apply to a sum of the RGB values of each pixel to get a z-height, in 'world coordinates', for each pixel (i.e. for each x,y location of the rectangular grid).

And the next frame contains the 2 scales for the 'longitude' ('yaw') and 'latitude' rotation angles --- around the fixed, 'viewing' axes --- the z-axis and the y-axis, respectively.

Also in that frame is the scale for zooming the model, in or out.

---

In the frame on the left (which can be switched to the right with the 'ToggleSide' button at the top of the GUI), you can see several groups of radiobuttons, each in their own frame.

The frames, from the top, are for

  • fill/outline radiobuttons
  • fill-color-source radiobuttons
  • fill-color-shading-type radiobuttons

---

In addition to showing these GUI features, the images above indicate that the default polygon-sort routine (painting starting from the 'far corner') does its job quite capably --- at least for these terrain surfaces that contain lots of polygons of approximately the same size (and no long 'slivers').

---

IMAGE SIZE CONSIDERATIONS
(including drawing speed)

The number of 'segments' of the rectangular grid in the x direction and in the y direction are determined by the pixel dimensions of the image file.

A 640x480 image file would generate a rather large grid (639 x 479 = 306,081 polygons) such that each polygon of the terrain surface would be less than 3 pixels across, if one shows the entire terrain surface on a high-resolution monitor, say about 1900x1200.

On a smaller monitor, say 1024x768, the polygons would be less than 2 pixels across --- especially since the canvas area is quite a bit smaller than the monitor size (about 60 to 70% of the monitor area).

Note that a 640x480 image file yields

  • 640x480 = 307,200 'rectangular-grid-points' in 2D and the same number of 'terrain-height-points' in 3D

  • a rectangular grid of 639 segments by 479 segments for 639 x 479 = 306,081 rectangles in the grid
    OR
    2 x 306,081 = 612,162 triangles if we ever convert each (not necessarily planar) quadrilateral over a grid rectangle into 2 (planar) triangles.

With the 3D OBJ/PLY/OFF/STL reader-viewer, the 'bunny' model that contained 69,451 faces --- what seemed like a superfluous number of triangular faces --- was drawn in about 14 seconds.

So we can expect a terrain generated from a 200x200 pixel image file, which would contain about 40,000 polygons, to take around 10 seconds to be drawn --- especially if we use a sort routine that does an 'lsort'.

Hence, this utility shows the user a warning popup message if the image file is going to create a terrain that will be difficult to show in its entirety --- say images larger than about 200x200 pixels.

---

Certainly these draw speeds are not as fast as a terrain viewer using OpenGL (and firmware in a graphics card to handle the 'graphics pipeline').

But the draw speed is not too shabby for free software --- and considering the large number of polygons --- and if you simply want to examine the terrain, not make it spin like a top.

I was pleasantly surprised that I could view pretty elaborate terrains --- surfaces with tens of thousands of polygons --- in a reasonable amount of time.

---

HELP TEXT

The 'Help' button on the GUI shows the following text. It describes the various ways in which a 'draw' is triggered.


** HELP for this
3D Terrain-Surface Generation-and-Examination Utility **

SELECTING/ENTERING AN IMAGE FILENAME:

When the GUI comes up, you can use the 'Browse...' button next to the image-filename entry field to select an image file from which to generate a terrain-surface to examine.

INITIAL DISPLAY OF THE TERRAIN SURFACE:

An Enter-key-press --- or MouseButton-3 (MB3) click-release --- on the filename entry field will cause a terrain surface (vertices and polygons) to be generated and plotted in the canvas area --- according to the current settings of the various generate and examine options in the GUI.

SAVING THE SURFACE:

If the surface looks useful, use the 'WriteOBJ' button to save the vertex and connectivity (polygon) data in a 3D data file in Wavefront OBJ format.

---

CHANGING THE GENERATED SURFACE :

If the image does not give the surface that you were seeking, you can take the image file into an image processing utility to create a different image file to try.

Then simply read in the new image file to see how it looks.

Or find and try a different image file.

Or write out an OBJ file and read it into a 3D model editor, like Blender or Wings3D, to change the terrain.

---

ALTERING THE GRID DISTANCES and HEIGHT FACTOR:

You can change the grid parameters --- xmin,xstep,ymin,ystep --- and z-height factor --- by entering new values.

To re-plot based on the new 'distance parameters', you can press the Enter key in any distance entry field --- or to re-plot at ANY time, you can MB3-click-release on any of the 'distance-entry-fields'.

Changing the distance parameters may not change the form of the surface, but they definitely change the data that would be written to a Save file, like a Wavefront OBJ file.

---

CHANGING THE VIEW ANGLE:

You can use the two 'angle-scale' widgets to quickly change either of a couple of rotation angles --- 'longitude' (yaw) or 'latitude'.

An MB1-release of the slider on a angle-scale widget causes a replot.

You can simply keep clicking in the 'trough' of either scale widget (to the left or right of the scale-button) to step through a series of re-plots, varying an angle one degee per click-release.

Or you can hold MB1 down, when the mouse cursor is to the right or left of the scale-button in the trough, to rapidly but rather precisely change to a new angle of rotation.

Releasing MB1 will cause a re-plot at the new angle.

---

ZOOMING:

You can use the 'zoom-scale' widget to magnify or shrink the plot.

An MB1-release of the slider on the zoom-scale widget causes a replot.

Click-release in the 'trough' --- on either side of the scale's button --- to zoom in/out a little at a time.

---

FILL-ONLY/FILL-and-OUTLINE/WIRE-hidden/WIRE-show-all:

The fill/outline/wire radiobuttons allow for showing the plot with the polygons color-filled or not --- and with outlines ('wireframe' mode) or not.

---

COLOR:

Three COLOR BUTTONS on the GUI allow for specifying a color for

  • the interior of the polygons
  • the outline of the polygons
  • the (canvas) background

from among 16 million colors, each.

---

Summary of 'EVENTS' that cause a 'REDRAW' of the plot:

Pressing Enter/Return key when focus is in the image-filename entry field. Alternatively, a button3-release on the image-filename entry field.

Pressing Enter/Return key when focus is in the

  • 'xmin' entry field
  • 'xstep' entry field
  • 'ymin' entry field
  • 'ystep' entry field
  • 'z-height-factor' entry field

Alternatively, a button3-release in any of these 'distance-entry-fields'.

Button1-release on the LONGITUDE or LATITUDE scale widget.

Button1-release on the ZOOM scale widget.

Button1-release on the either of the 2 WIRE radio-buttons.

Button1-release on any of the SHADING option radio-buttons.

Changing color via the FILL-COLOR or OUTLINE-COLOR buttons.

ALSO: Resizing the window changes the size of the canvas, which triggers a redraw of the plot according to the new canvas size.


Description of the code

I provide the code for this 3D terrain generator-and-examiner Tk script below.

I follow my usual 'canonical' structure for Tk code for this Tk script:


  0) Set general window & widget parms (win-name, win-position,
     win-color-scheme, fonts, widget-geometry-parms, win-size-control,
     text-array-for-labels-etc).

  1a) Define ALL frames (and sub-frames, if any).
  1b) Pack   ALL frames and sub-frames.

  2) Define & pack all widgets in the frames, frame by frame.
     Within each frame, define ALL the widgets. Then pack the widgets.

  3) Define keyboard and mouse/touchpad/touch-sensitive-screen action
     BINDINGS, if needed.

  4) Define PROCS, if needed.

  5) Additional GUI initialization (typically with one or more of
     the procs), if needed.


This structure is discussed in more detail on the page A Canonical Structure for Tk Code --- and variations.

This structure makes it easy for me to find code sections --- while generating and testing a Tk script, and when looking for code snippets to include in other scripts (code re-use).

I call your attention to step-zero.

One new thing that I have started doing recently is using a text-array for text in labels, buttons, and other widgets in the GUI.

This can make it easier for people to internationalize my scripts.

I will be using a text-array like this in most of my scripts in the future.


Experimenting with the GUI

As in all my scripts that use the 'pack' geometry manager (which is all of my 100-plus scripts, so far), I provide the four main 'pack' parameters --- '-side', '-anchor', '-fill', '-expand' --- on all of the 'pack' commands for the frames and widgets.

That helps me when I am initially testing the behavior of a GUI (the various widgets within it) as I resize the main window.

I think that I have used a nice choice of the 'pack' parameters.

The labels and buttons and scales stay fixed in size and relative-location as the window is re-sized --- while the 'canvas' expands/contracts as the window is re-sized.

You can experiment with the '-side', '-anchor', '-fill', and '-expand' parameters on the 'pack' commands for the various frames and widgets --- to get the widget behavior that you want.

---

Additional experimentation:

You might want to change the fonts used for the various GUI widgets. For example, you could change '-weight' from 'bold' to 'normal' --- or '-slant' from 'roman' to 'italic'. Or change font families.

In fact, you may NEED to change the font families, because the families I used may not be available on your computer --- and the default font that the 'wish' interpreter chooses may not be very pleasing.

I use variables to set geometry parameters of widgets --- parameters such as border-widths and padding. And I have included the '-relief' parameter on the definitions of frames and widgets.

Feel free to experiment with those 'appearance' parameters as well.

---

Note that the color buttons call on a color-selector-GUI script to set the colors.

You can make that color-selector script by cutting-and-pasting the code from the page 'A non-obfuscated color selector GUI' on this site.


Some features in the code

That said, here's the code --- with plenty of comments to describe what most of the code-sections are doing.

You can look at the top of the PROCS section of the code to see a list of the procs used in this script, along with brief descriptions of how they are called and what they do.

---

As in my other three 3D viewer scripts, one interesting feature of this GUI is the way that the code involved in a redraw is broken up into a sequence of procs.

In this script, the sequence is:

  1. load_points_array
  2. translate_points_array
  3. rotate_points
  4. sort_polyIDs_list
  5. draw_2D_pixel_polys

Some 'events' --- such as MB3-click-release on the image filename entry field --- triggers the execution of all 5 procs (in that order).

Other events (like longitude or latitude change) trigger the execution of only the last 3 procs.

Clicking on one of the 'sort' radiobuttons triggers the execution of only the last 2 procs.

And some 'simple' changes (like a color change or a switch to wireframe mode) trigger the execution of only the last proc.

Note that I do most of the calculations in 'world coordinates', NOT pixel coordinates.

All the coordinate calculations in the first 3 procs are done in world coordinates.

It is in the 5th proc that I obtain a set of 2D points from a family of 3D points, and I map a 'bounding area' of the 2D points into the current canvas area, in units of pixels --- to finally get the plot, via 'create polygon' commands.

---

To implement the 'sort_polyIDs_list' proc, I provide several 'compare' procs for the '-command' option of the 'lsort' command.

For details on the different comparison techniques used in those procs, see the procs named

  • compare_2polyIDs_by_MAXzdepth
  • compare_2polyIDs_by_AVEzdepth
  • compare_2polyIDs_by_biggerMINzdepth

---

Note that the 'write_obj' proc may be of use to others who need such a 3D model file writer in their Tcl-Tk applications.


It is my hope that the copious comments in the code will help Tcl-Tk coding 'newbies' get started in making GUI's like this.

Without the comments, potential young Tcler's might be tempted to return to their iPhones and iPads and iPods --- to watch videos of snow-mobilers cushioning the fall of their snow-mobiles with their bodies.


Tcl-Tk SOURCE CODE

Here is a link to the CODE for Tk script
3DterrainGeneratorExaminer_ fromImgFiles_ RyRz_quads.tk


ALPHABETIC TERRAINS

When I was thinking about image files to use for making interesting terrains, it occurred to me that I could use a terrain generator to make interesting variations on letters of the alphabet.

In fact, I can use my 'Title Block' utility at wiki.tcl.tk --- titled 'A GUI for making 'Title Blocks' ... with text, fonts, colors, images' --- to put white letters on a black background (with a literally unlimited choice of fonts).

Then I can capture the screen and take it into an image editor, like 'mtpaint', to crop the image and blur the letters to make a suitable image for terrain generation --- like the following image:

And here is an example of one kind of image that you can generate from alphabetic letters using this terrain generator.

And you could make terrains from pictures of favorite pets, pictures of children or grand-children, images of favorite cartoon characters, and so on.

The list of possibilities is endless.

    (The little 'glitches' in the image above made me realize that I could add a 'Smooth' button to the GUI.

    Clicking on it could perform an action on the terrain similar to a 'blur' button in a 2D image editor.

    For example, a proc could sweep through the points array recomputing the z value for each point based on an average from the points around it.

    One could provide options to use 4, 5, or 9 points in the neighborhood, say.

    By repeatedly clicking on the 'Smooth' button, you could get more and more 'evening out' of the surface.

    And you have an 'Undo' option --- by simply MB3-clicking on the filename entry field, to reload the terrain data from the image file.)


The WRITE-OBJ OPTION

In testing the 'Write-OBJ' option of this terrain generator utility, I generated an OBJ file and decided to use my 3D OBJ/PLY/OFF/STL reader-viewer utility to see if the OBJ file was readable.

The image below is evidence that this terrain utility is capable of generating good OBJ files.

(I used the option to randomly color the polygons --- in this case, all 'quads'.)

I must admit that I had to fix a couple of bugs in my initial code for the 'write_obj' proc of the terrain utility before I could successfully read the file.

In any case, I feel confident now that the Write-OBJ feature is working --- and that if I ever want to add some color capabilities to the writer, I can do so.


THE SHADING-BY-LIGHTING OPTION

For the initial release of the 3D OBJ/PLY/OFF/STL reader-viewer script, the SHADING option called 'byLighting' was grayed-out (not implemented yet).

I put a 'cross_product' proc in the terrain generator-viewer script to take into account the angle that polygon normals make with a light direction --- for simplicity, assuming the light is down the viewing axis, i. e. coming from the user/viewer.

That option seems to be working OK.

I had feared that the computations involved in computing the cross-product for thousands of polygons would increase the draw time considerably.

However the draw times for the 'byLighting' shading option seem to be comparable to the draw-times for the 'byZheight' and 'byViewDepth' options.

In any case, I may 'back port' the 'byLighting' shading option into the 3D OBJ/PLY/OFF/STL reader-viewer script.

Then I should be able to get nice shading of the gear model --- as well as nice shading on other models such as car, airplane, boat, and StarWars/StarTrek cruiser models, for which I was unable to get pleasing shading via the height/depth shading options.

Below is an example of output from the shading 'byLighting' option.

It was generated from this image file.


GUI LAYOUT OPTIONS

In the 3D OBJ/PLY/OFF/STL reader-viewer script, I put all the non-canvas frames at the top of the GUI, strung out across the GUI.

I pointed out that that GUI layout works out well for long horizontal objects --- like cars, airplanes, boats, cows, and horses.

But for tall objects, it might be better to put many of the frames (like several of the radiobutton frames) into Tk frames on the left or right of the GUI.

For this terrain viewer, I decided to try that type of 'control buttons on the left (or right)' layout.

In the screen captures above, you can see a 'ToggleSide' button.

Clicking on that button a couple of times quickly moves the frames on the left of the GUI to the right side of the GUI, and back again.

I implemented that side-to-side switch capability by using the Tk 'pack forget' command --- as I have done in several other scripts that I have contributed to the Tclers' wiki.

For example, the technique is used for switching the color-swatch from right to left, and back, in the color-selector script that I mentioned above.


THE FIXED-COLOR-TABLE and RANDOM-COLOR-TABLE OPTIONS

The following image illustrates the effect achieved by using the 'fixed-color-table' radiobutton from among the 'fill-color-source' radiobuttons.

The colors in this image came from an 11-element array that is hard-coded in the script.

If you want to change the colors, simply change the script. And you can add more colors if you like.

The 'random-color-table' option allows you to quickly experiment with applying random colors to the polygons (according to the z-height of the polygons).

It works by building a color table of random colors (the same number of colors as are in the fixed-color-table) and applying those colors to the polygons each time you click a GUI item that causes another re-draw of the terrain.

The script re-builds the random-colors table each time a re-draw is done.

So, for example, you can keep clicking on one of the 'fill shading type' radiobuttons to keep causing redraws.

Each redraw will show the image with colors from a different set of random colors.

I would put an image here to show the 'random-color-table/z-height' effect, but this page is already loaded with large images.

In any case, if you do not like how the fixed or random color tables were implemented, you can simply change the code to do it as you perfer.


SCALES ('SLIDERS') RESPONSE

'-repeatdelay 500' and '-repeatinterval 50' parameters are present on all three 'scale' widgets.

If the responsiveness of the sliderbar movements is not to your liking (when you press-and-hold mouse-button-1 over a scale's trough --- to rapidly make changes of about 5 to 10 degrees in a view angle), you can change these milliseconds values.


SOME POTENTIAL ENHANCEMENTS:

Eventually some other features may be added to this utility :

  • ** A checkbutton may be added to allow for turning on/off a 'triad' display, that indicates the current direction of the 'local' xyz coordinate axes of the terrain.

  • ** Add the ability to PAN the model, as well as rotate and zoom it.

  • ** Add the ability to use mouse-motions on the canvas area to move the model.

    For example:
    MB1 to rotate, MB2 to zoom, and MB3 to pan the terrain.

  • **Add the 'Smooth' button mentioned above --- to 'blur' or 'smooth' color-change lines in the image.

  • ** Depth clipping may be added --- so that the user can essentially get section views of the terrain.

  • ** A check-button may be added to allow for switching to a 'perspective' view, from the current 'parallel projection'.

  • ** A check-button may be added to allow for 'backface culling', to speed up the plots when lots of polygons are not facing the viewer and perhaps would be hidden --- for example, polygons on the back-side of 'mountains' in the terrain.

  • **More elaborate shading techniques may eventually be implemented --- such as Gouraud-like shading (color interpolation) --- to get smoother shading effects across polygon edges, and perhaps to get glossy effects.

      (These effects may be easiest to implement by using colors assigned to polygon vertex points rather than colors assigned to polygons.

      In fact, in this script, I store an RGB color triplet, taken from each pixel's color, for each point in the terrain surface.)

    This color interpolation would really slow each plot down (much slower than the shading 'byZheight', 'byViewDepth' and 'byLighting' options), but having the color-interpolation option might be worth it, to get a higher quality image --- if it can be done within 10 to 30 seconds for a 2,000 face model, say.

      (Unfortunately, there is no color-interpolation option built into the Tk 'create polygon' command for the canvas.

      I would like to suggest this for Tk 9.0 --- at least in the case when the polygons are triangles --- allow for specifying a different color at each of the 3 vertices --- and interpolate the 3 colors across the polygon, perhaps by using barycentric coordinates.

      In C code, this might proceed at a reasonably fast pace.)

  • ** No doubt, there are some ways to change the calculations and/or procedures to get a significant speed up of the redraws and thus allow for smooth rotation of fairly large terrains.

    If this script is enhanced to allow for 'immediate' rotation according to mouse motion on the canvas, then the rotation will definitely be a bit 'jumpy' --- even for 'small' terrains on the order of a few thousand polygons.

    So it behooves one to find ways to speed up the procs in the 'graphics pipeline'.

  • ** This enhancement list may be extended.

I may add a few more ideas for enhancements to this script in coming months (or years), as I tackle other 3D utilities.


NEXT 3D PROJECTS

The four 3D-viewer scripts that I have developed so far have given me a wealth of procs and techniques that will be very useful to me.

The procs of these 4 scripts will be useful for other 3D Tk-script projects --- such as a molecule-viewing utility --- one of the next 3D projects on my to-do list.

In that project, I will be reading in a '.mol' file instead of an image file (GIF or PNG) and instead of a 3D model file (OBJ, PLY, OFF, STL, etc.).

I can take my read-OBJ file proc, say, and convert it into a read-MOL file proc.

Another task:
I need to 'back-port' some items from this terrain utility --- namely, the color-table 'fill-source' option and the 'by-lighting' 'fill-shade' option --- into the 3D OBJ/PLY/OFF/STL reader-viewer script.


IN CONCLUSION

The script on this page is certainly not as capable or fast as some commercial 3D terrain file viewers --- but I say:

There's a lot to like about a utility that is 'free freedom' --- that is, no-cost and open-source so that you can modify/enhance/fix it without having to wait for someone else to do it for you (which may be never). So once again ...

A BIG THANK YOU to Ousterhout for starting Tcl-Tk, and a BIG THANK YOU to the Tcl-Tk developers and maintainers who have kept the simply MAH-velous 'wish' interpreter going.

Bottom of this page for a
3D Terrain Generator-and-Examiner,
using image file input

--- a utility in the FE 'tkGooies' system,
in the '3Dtools' group.

To return to a previously visited web page location, click on the Back button of your web browser a sufficient number of times. OR, use the History-list option of your web browser.
OR ...

< Go to Top of Page, above. >

Page history:

The first releasable version of this code was posted in 2013 Jan at http://wiki.tcl.tk/37659.

This FE web page was created 2014 May 05.
(as a backup and alternative to the wiki.tc.tk page)

This page was changed 2019 Feb 23.
(Added css and javascript to try to handle text-size for smartphones, esp. in portrait orientation.)

Page was changed 2019 Jun 16.
(Specified image widths in percents to size the images according to width of the browser window. Also tried to clarify several sections --- for example, the section on the 'longitude' and 'latitude' rotation angles.)


NOTE:
The code here MAY become more 'up-to-date' than the code posted on the Tcler's Wiki --- wiki.tcl-lang.org --- formerly wiki.tcl.tk.